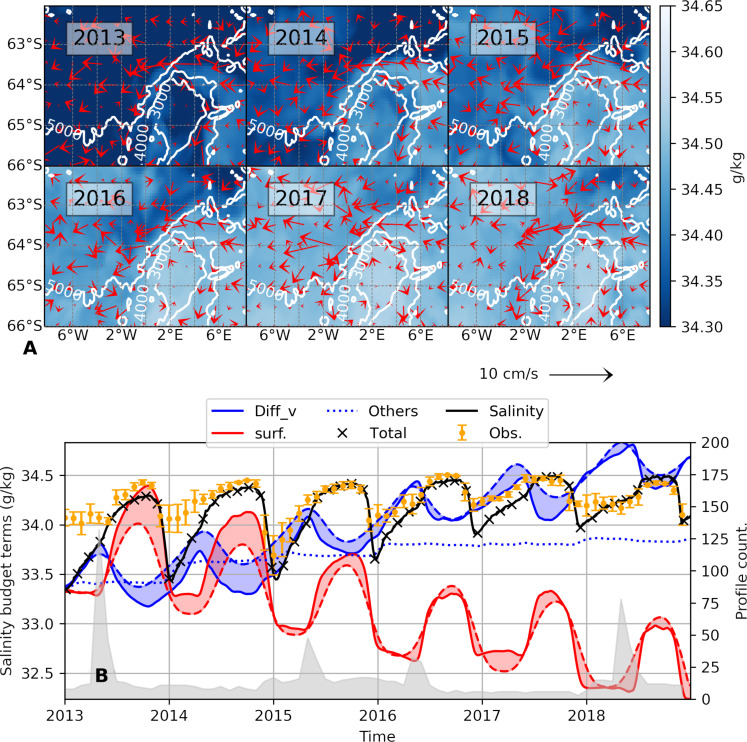
Fig. 2. Surface salinity from the SOSE.
(A) September-mean surface salinity, computed as upper 20 m averages, for the years 2013–2018. Vectors are the September-mean geostrophic velocity. White contours show isobaths. (B) Salinity balance, spatially averaged [over the area in (A)] and cumulatively summed in time, and vertically averaged in the uppermost 20 m. The black curve is the salinity, the “x” markers denote the sum of the salinity balance terms, and the orange markers are the monthly mean of observed salinities (spatially averaged, with their associated monthly SD). The salinity balance terms for vertical diffusion and surface fluxes are shown, while the other terms are summed up and displayed as “others” (see Materials and Methods). Continuous lines are the instantaneous values, while the broken lines are the monthly means. The shading emphasizes the difference between these two lines where shading above dashed lines indicates a positive anomaly. The light gray shading at the bottom is the number of observed profiles plotted against the right-hand y axis.

