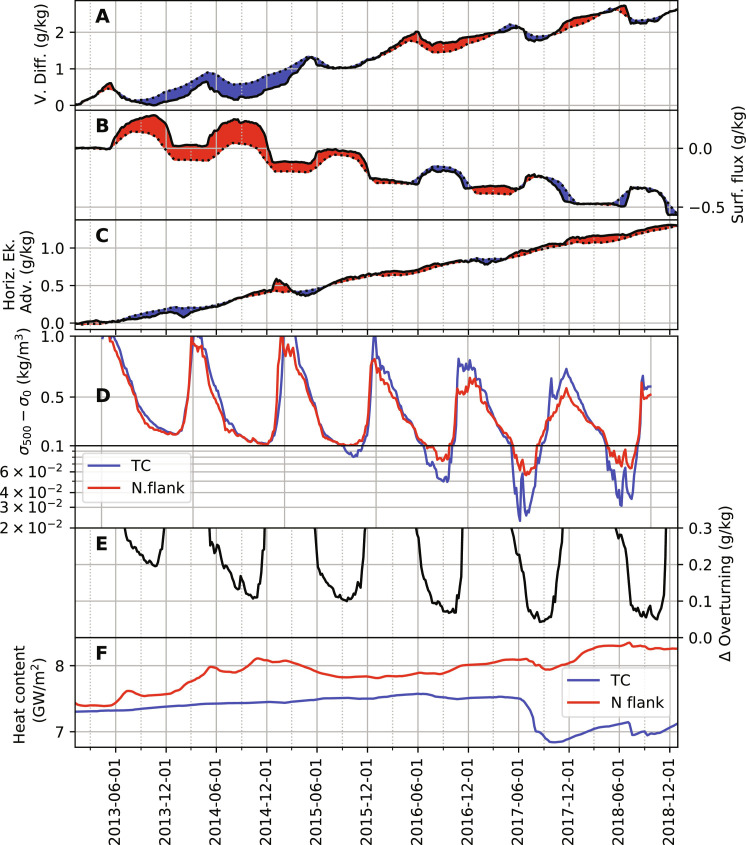
Fig. 7. Spatially averaged properties of the northern flank.
(A) Time-integrated vertical diffusion of salinity (upper 20 m average), (B) time-integrated surface flux of salinity, and (C) time-integrated horizontal Ekman advection of salinity. Red shades denote positive anomalies, and blue negative with respect to monthly climatological averages. The northern flank is as defined in Fig. 5C. (D) Difference between potential density at depths of 500 m and the surface, averaged over the Taylor cap (blue line) and the northern flank (red line). Note that the y axis switches to a logarithmic scale below values of 0.1. (E) Δov (see Materials and Methods), defined as the difference between the overturning limit of salinity and the mixed-layer salinity. (F) Oceanic heat content over the Taylor cap (TC) and the northern flank of Maud Rise (N flank), integrated over depths of 200 to 1000 m.

