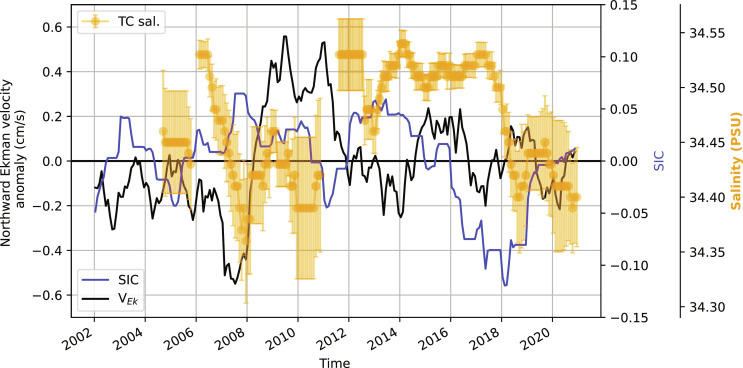
Fig. 8. Synthesis of observations of the northern flank of Maud Rise.
Seasonal anomaly in the northward Ekman velocity (black curve; derived from remotely observed ocean surface stresses; see Materials and Methods), sea ice concentrations (SIC; blue curve; seasonal anomaly), and monthly mean surface salinity observed by profiling floats and tagged seals over the Taylor cap (orange markers; error bar indicates ±1 SD; see fig. S5 for profile locations).

