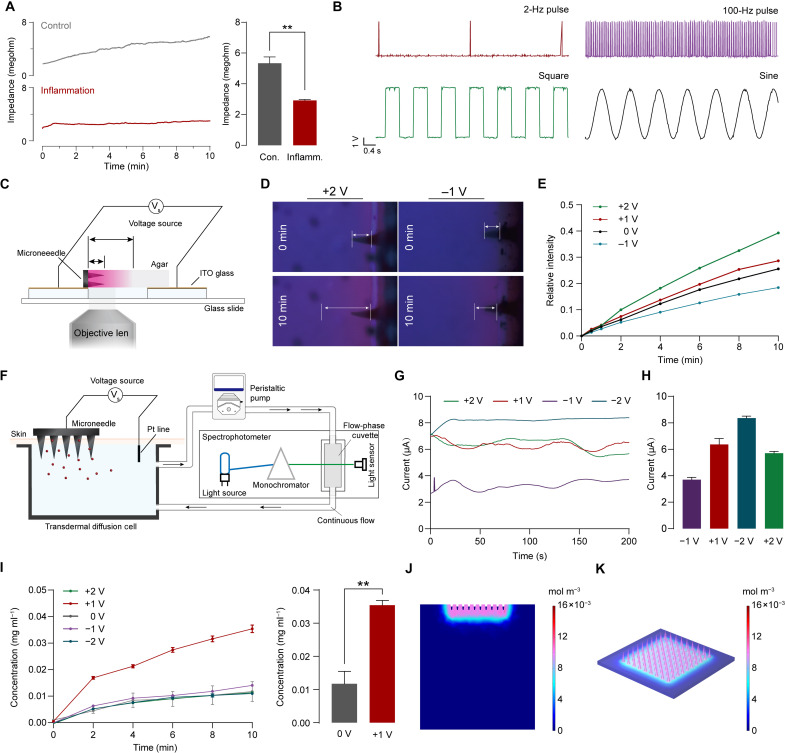
Fig. 4. Multimodal reconfigurable features of ISD for impedance sensing, electrical stimulation, and transdermal drug delivery.
(A) Representative transdermal impedance curve and the comparison of the normal and inflammatory tissue. (B) Characterization of the pulse, square and sine waveform generated. (C) Illustration of the device for observing the transport process. (D) Fluorescence images of the dye transport under +2- and −1-V bias voltage. (E) Quantification of fluorescence intensity with different times and voltages. (F) Illustration of a circulation device for real-time transdermal simulation. (G) Current-time curves (in absolute value) of the transdermal delivery in different potential biases. (H) Comparison of current at different bias voltages. (I) Concentration profiles versus time for different potential biases and comparison of concentrations after 10 min of transdermal delivery at 0-V and +1-V bias. (J) Distribution of the substance concentration in the tissue at +1-V bias. (K) Distribution of substance concentration in the microneedle at +1-V bias. ITO, indium tin oxide. Data are means ± SD (n = 3). **P < 0.01

