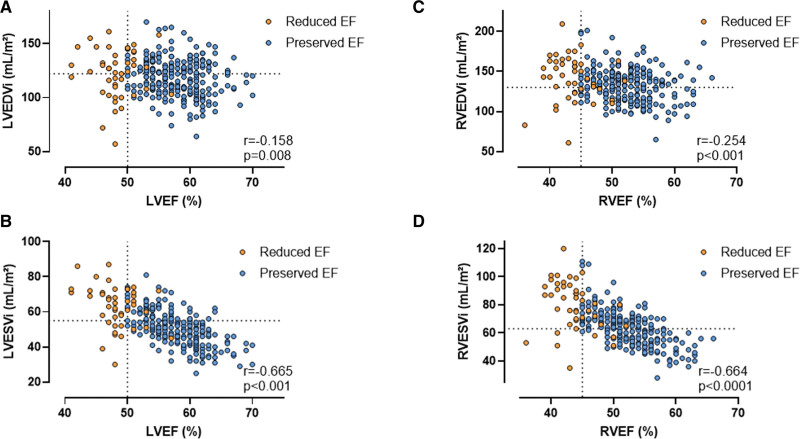
Figure 2.
The correlation between ejection fraction, end-diastolic volumes, and end-systolic volumes. Scatter plot and correlation analysis between (A) LVEF and LVEDVi, (B) LVEF and LVESVi, (C) RVEF and RVEDVi, and (D) RVEF and RVESVi. The vertical dotted lines represent the cutoff values of reduced LVEF at 50% and RVEF at 45%. The horizontal dotted lines represent the upper limit of the 99% CI of LVEDVi (122 mL/m²), LVESVi (55 mL/m²), RVEDVi (130 mL/m²), and RVESVi (63 mL/m²) as reported by D’Ascenzi et al.14 EF indicates ejection fraction; LV, left ventricular; LVEDVi, indexed left ventricular end-diastolic volume; LVESVi, indexed left ventricular end-systolic volume; RV, right ventricular; RVEDVi, indexed right ventricular end-diastolic volume; and RVESVi, indexed right ventricular end-systolic volume.

