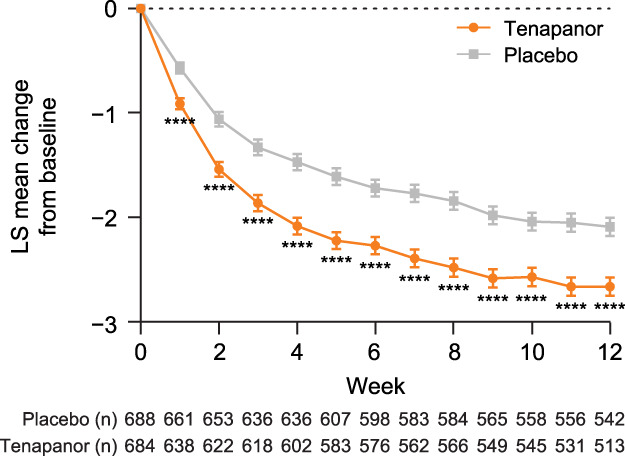
Figure 2.

LS mean change from baseline in Abdominal Score over the first 12 weeks of treatment (pooled population). Error bars represent SE. LS mean, SE, and P values came from an unstructured MMRM with fixed-effect factors of treatment, week, and treatment-by-week; fixed-effect covariates of baseline Abdominal Score and baseline-by-week; and patient as a random effect. ****P < 0.0001. Abdominal Score was defined as the mean of weekly scores for abdominal pain, discomfort, and bloating. LS, least squares; MMRM, mixed-effects model with repeated measures; n, the number of patients included in the summary in the corresponding study week.
