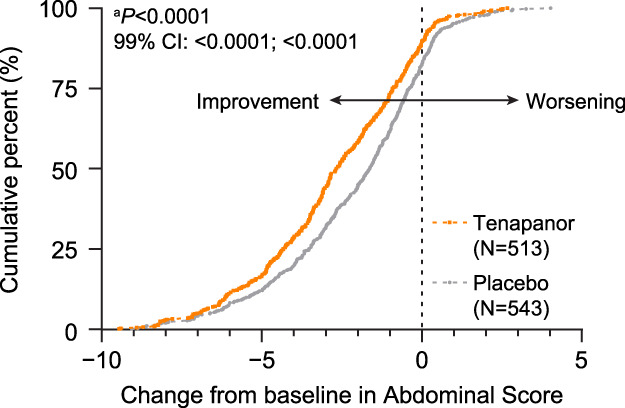
Figure 3.

Cumulative distribution function of change from baseline to week 12 in Abdominal Score (pooled population). The cumulative distribution function plot illustrates the percentage of patients (y-axis) achieving a certain level of response as assessed by the change from baseline in Abdominal Score (x-axis). This plot shows that the tenapanor group had a consistently higher percentage of patients achieving a certain level of response compared with the placebo group, supporting the efficacy of tenapanor. Negative values of change from baseline are indicative of improvement, whereas positive values indicate worsening. aEstimated P-value comparing the cumulative distribution functions between treatment arms was obtained from a Wilcoxon 2-sample test. Abdominal Score was defined as the average of weekly scores for abdominal pain, discomfort, and bloating.
