
Extended Data Fig. 2 |. Metformin inhibits complex I to drive Lac-Phe production in primary macrophages.
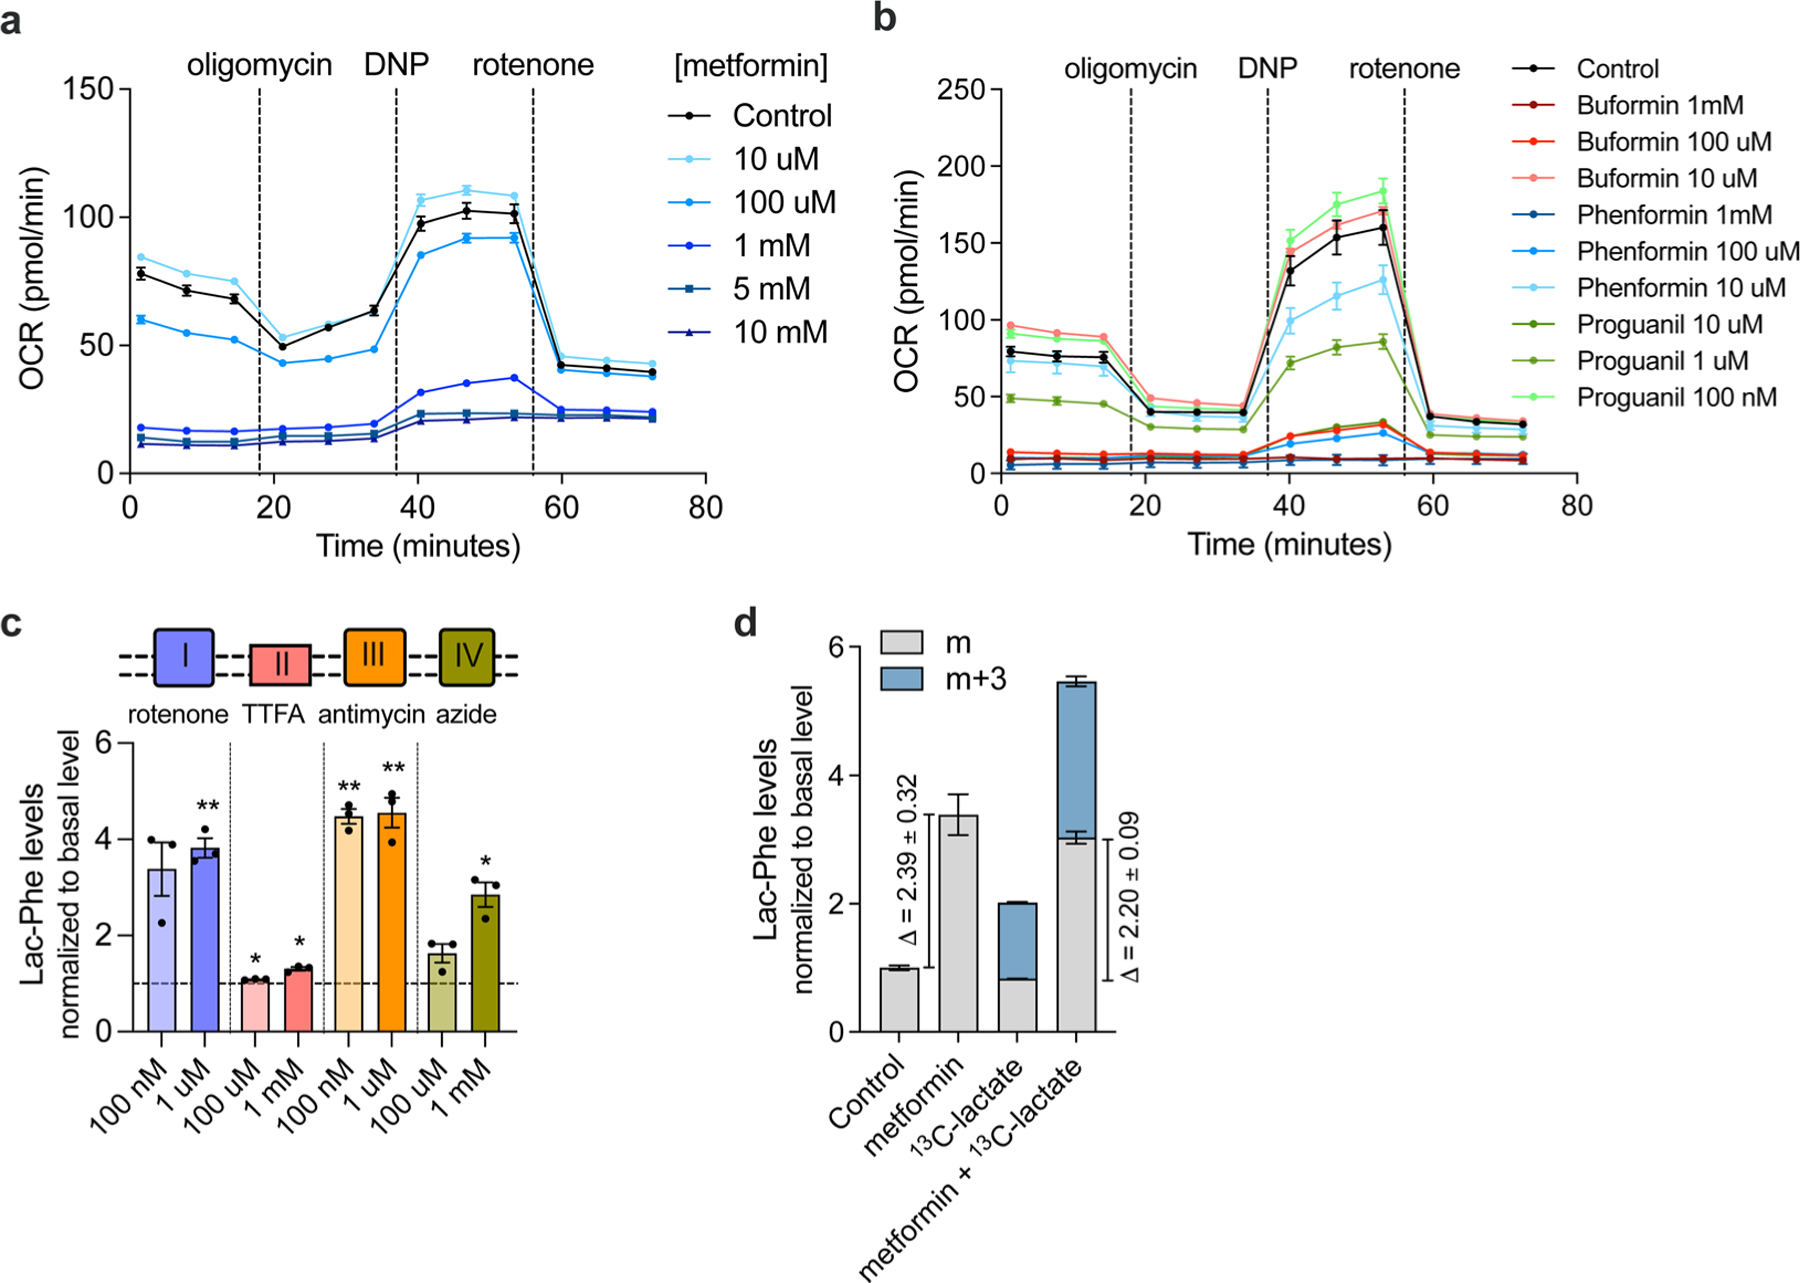
(a) Cellular respiration following treatment of primary macrophages with the indicated concentrations of metformin (n = 5/concentration). (b) Cellular respiration of primary macrophages following treatment with the indicated concentrations of biguanides overnight (n = 5/concentration for biguanides, N = 6/concentration for control). (c) Fold-change in media Lac-Phe levels in primary macrophages following overnight treatment with the indicated inhibitor of oxidative phosphorylation at the indicated concentration (n = 3/concentration) (d) Fold-change in media Lac-Phe levels or 13C-labeled Lac-Phe levels in primary macrophage (n=3/condition) using 13C-labeled lactate. P values in (c) were calculated using two-sided one sample t test. *p < 0.05, **p < 0.01. The exact p values in (c) are: 0.051, 0.005, 0.011, 0.014, 0.002, 0.008, 0.084, 0.018. N values from (a-d) represent biological independent samples. All error bars are SEM.