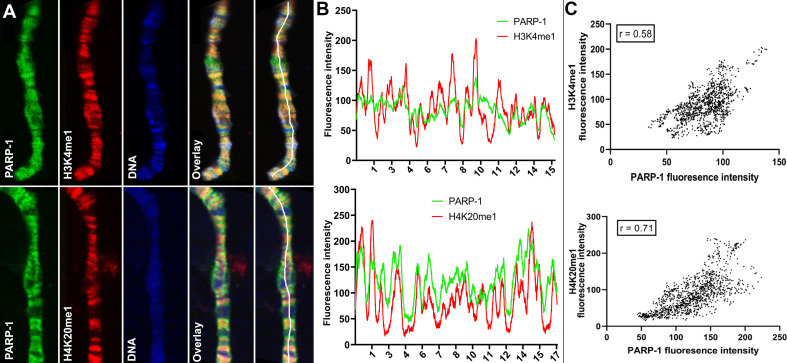
Figure 2. PARP-1 colocalizes with H3K4me1 and H4K20me1 histone marks in polytene chromosomes.
(A) Immunofluorescent staining of Drosophila salivary gland chromosomes showing colocalization of PARP-1 with H3K4me1 and H4K20me1. White lines indicate areas of the colocalization-quantification shown in (B). (B–C) Quantification of fluorescence intensity of PARP-1, H3K4me1, and H4K20me1 at Drosophila polytene chromosomes in panel A. (B) Images show the distribution of PARP-1 fluorescence Intensity with H3K4me1 (top) and H4K20me1 (bottom) fluorescence intensity. (C) Images represent a scatterplot showing PARP-1 fluorescence intensity with H3K4me1 (top) and H4K20me1 (bottom) fluorescence intensity. Pearson correlation coefficients (r) are respectively 0.58 (top) and 0.71 (bottom).

