. 2024 May 1;13:RP91482. doi: 10.7554/eLife.91482

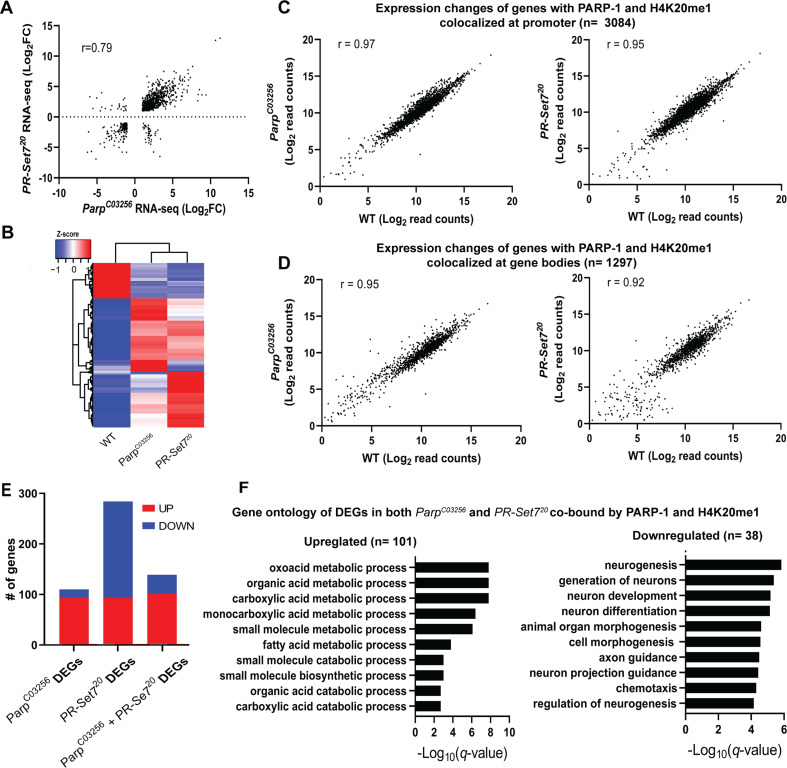
Figure 3. PARP-1 and H4K20me1 are required for the repression of metabolic genes and activation of developmental genes at co-enriched genes.

(A) Scatterplot plot showing correlation of differentially expressed genes (DEGs) in parp-1C03256 and pr-set720 (Pearson’s r=0.79). (B) Heatmap showing the normalized read counts of DEGs in both parp-1C03256 and pr-set720. Normalized read counts are shown as row z-scores. (C–D) Dot plots showing transcriptional changes of genes co-enriched with PARP-1 and H4K20me1 in parp-1C03256 and pr-set720 compared to WT at promoters (C) and gene bodies (D). (E) Summary of DEGs in parp-1C03256 and pr-set720 and both mutants that were co-enriched with PARP-1 and H4K20me1. (F) Gene ontology of upregulated (left) and downregulated (right) DEGs in both parp-1C03256 and pr-set720 mutants that were co-enriched with PARP-1 and H4K20me1.

Figure 3.

Figure 3—figure supplement 1. Validation of pr-set720 mutant.
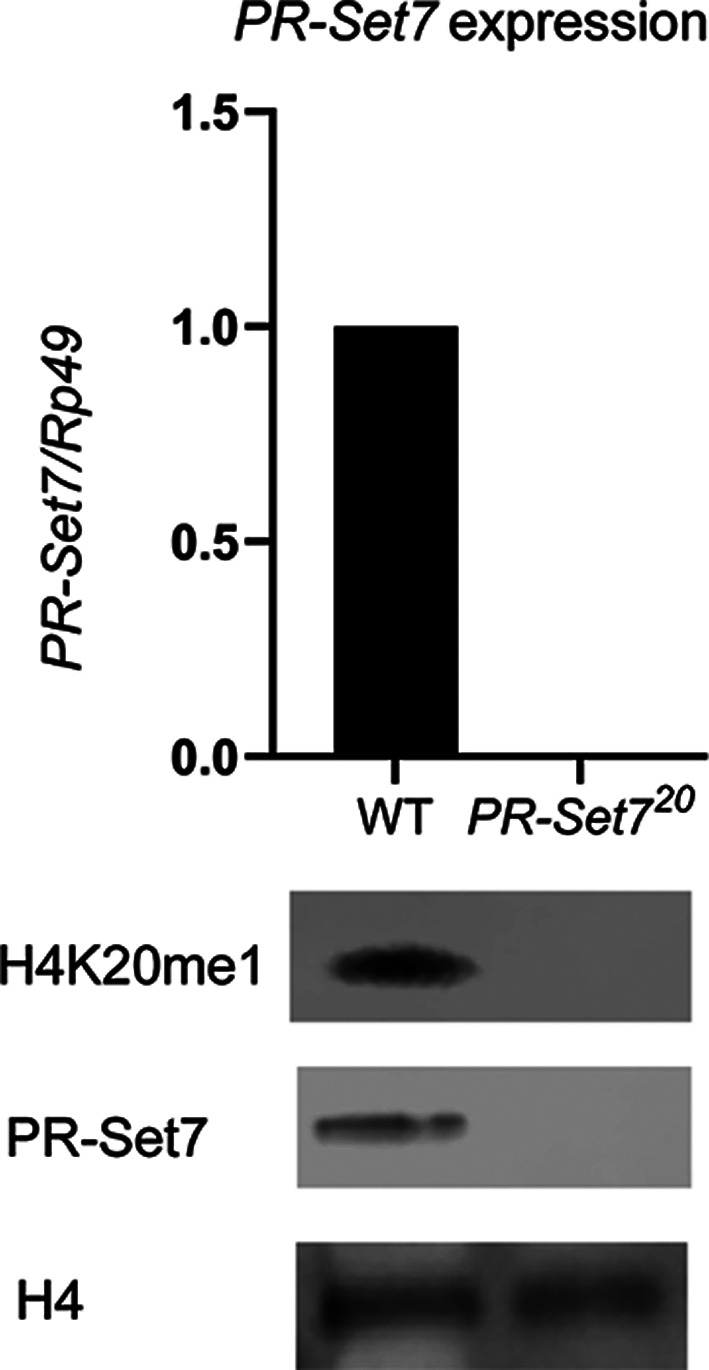
Figure 3—figure supplement 1.

(Top) Expression levels of PR-SET7 in wild-type (WT) or pr-set720 mutant during third-instar larval stage (three biological replicates). (Bottom) Western blot of H4K20me1, PR-SET7, and H4 loading control in WT or pr-set720 mutant during third-instar larval stage (two biological replicates).
Figure 3—figure supplement 1—source data 1. Original file for the Western blot analysis in Figure 3—figure supplement 1.
Figure 3—figure supplement 1—source data 2. Figure 3—figure supplement 1 and original scans of the relevant Western blot analysis with highlighted bands and sample labels.
Figure 3—figure supplement 2. PR-SET7 expression level is not affected in parp-1C03256 mutant.
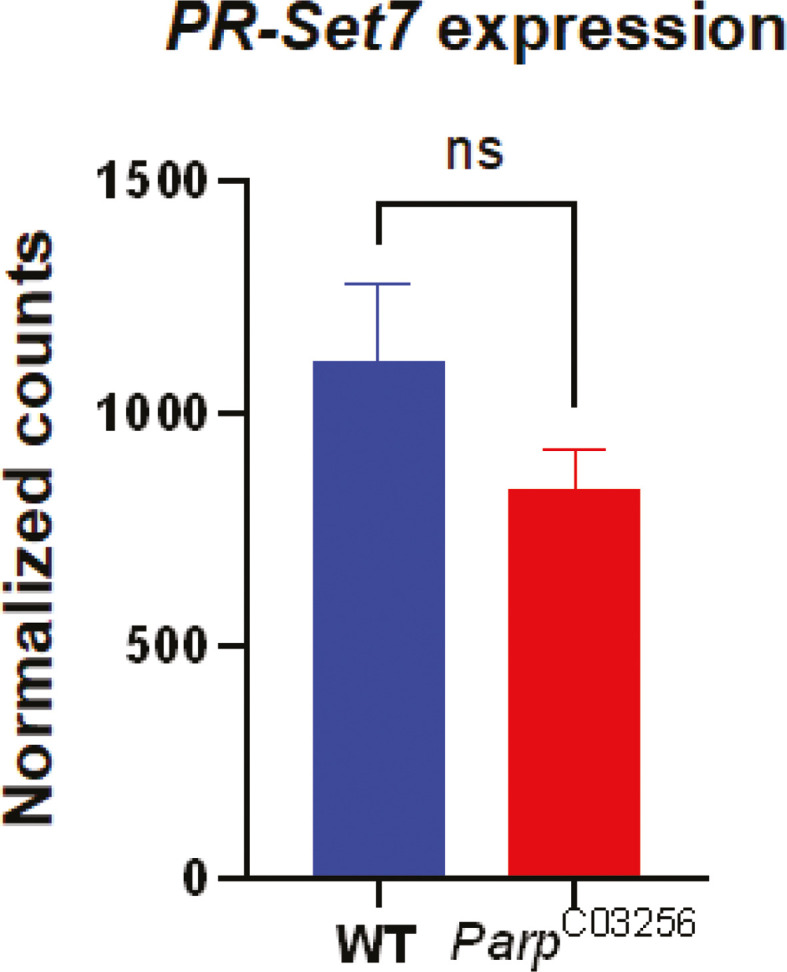
Figure 3—figure supplement 2.

Normalized counts of Pr-SET7 RNA in a wild-type (blue) or in a parp-1C03256 (red) background based on RNA-seq data (GSE222877). The experiment was performed in triplicates. The statistical test is an unpaired two-tailed t-test. (ns): non-significant. Data are presented as mean ± SEM.
Figure 3—figure supplement 3. PR-SET7 protein level is not affected in parp-1C03256 mutant.
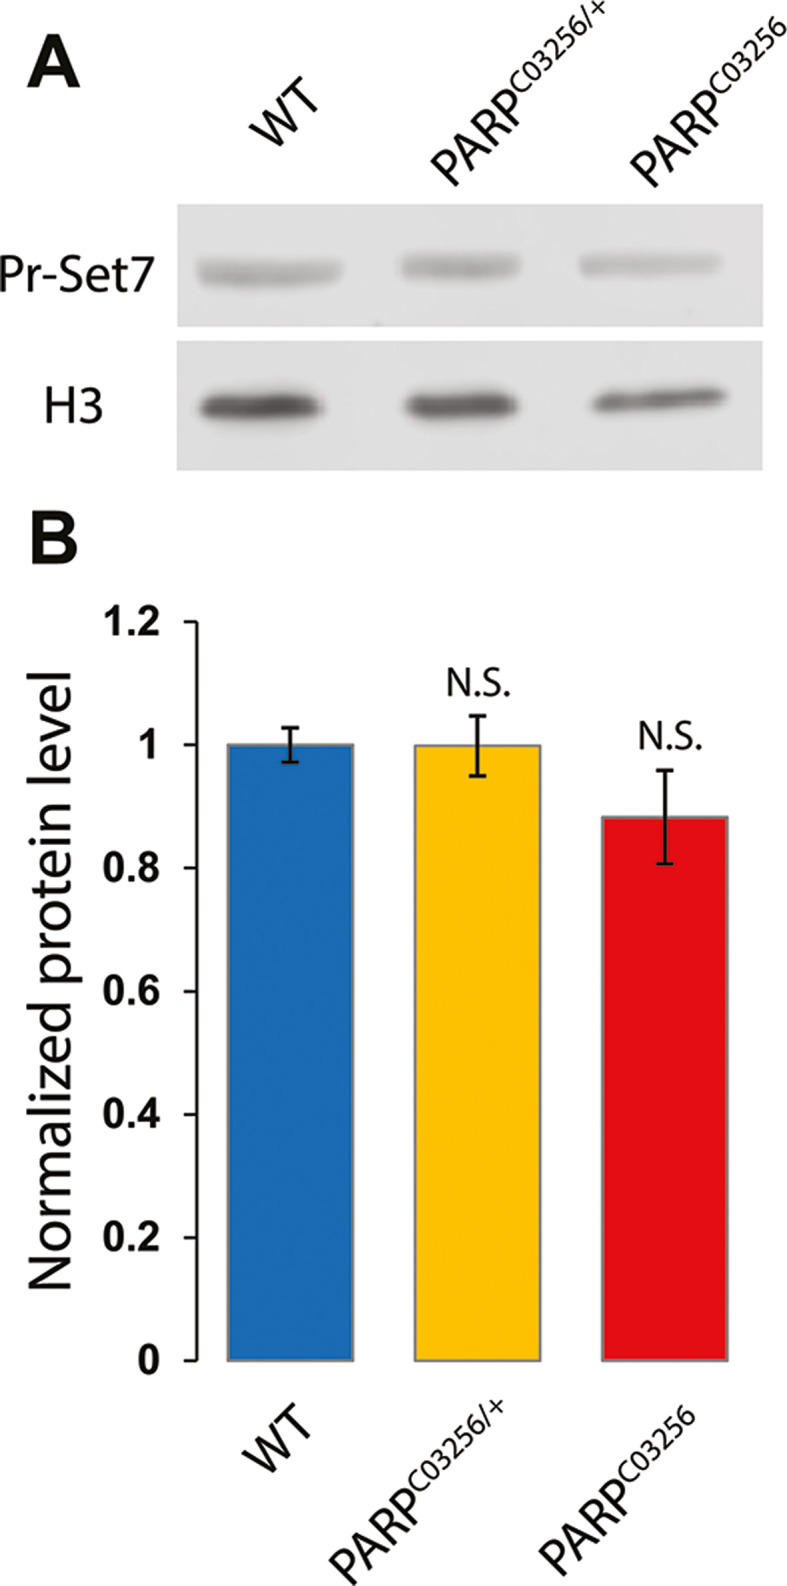
Figure 3—figure supplement 3.

(A) Western blot showing Pr-SET7 protein level in a wild-type (WT), parp-1 heterozygote (ParpC03256/+), or homozygote mutant (ParpC03256) background. H3 is used as a loading control. (B) Quantification of PR-SET7 protein level based on three independent biological replicates and normalized to H3 level. The statistical test is an unpaired two-tailed t-test. N.S: non-significant.
Figure 3—figure supplement 3—source data 1. Original file for the Western blot analysis in Figure 3—figure supplement 3.
Figure 3—figure supplement 3—source data 2. This file containing Figure 3—figure supplement 3 and original scans of the relevant Western blot analysis with highlighted bands and sample labels.
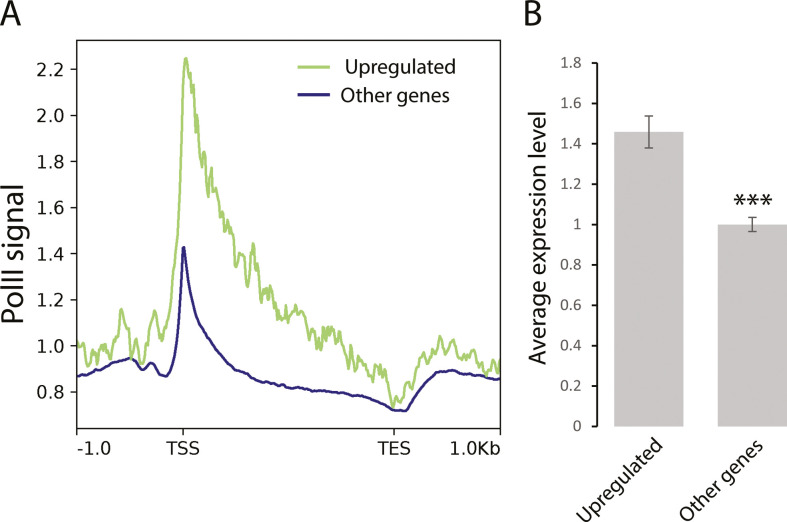
Figure 3—figure supplement 4. Genes coenriched in H4K20me1 and PARP-1 that are upregulated in both parp-1 and pr-set7 mutants are highly expressed genes.

Figure 3—figure supplement 4.

(A) Distribution of RNA-Polymerase II (PolII) protein along genes that are coenriched by H4K20me1 and PARP-1 and upregulated both parp-1 and pr-set7 mutants (green) and along all other Drosophila genes (blue). The region of all target genes is scaled to a 2 kb region (from TSS to TES) and includes the 1 kb region upstream from transcription start site (TSS) and downstream from TES. The analysis was performed on the whole organism on Drosophila third instar larval puffstage 7–9. (B) Average expression level of genes coenriched by H4K20me1 and PARP-1 and upregulated both parp-1 and pr-set7 mutants (upregulated) and average expression of all other genes. The expression was measured on the whole organism on Drosophila third instar larval puffstage 7–9. Statistical test is an unpaired two-tailed t-test. ***p-value <0.01.
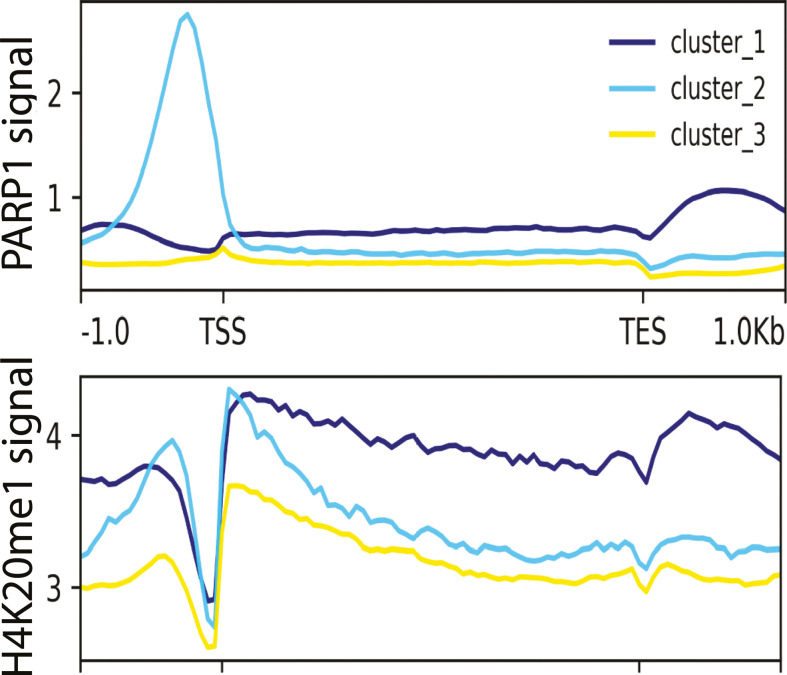
Figure 3—figure supplement 5. PARP-1 binding correlates with H4K20me1 enrichment in Human K562 cells.

Figure 3—figure supplement 5.

Metagene plots showing enrichment of PARP-1 (CUT&Tag) and H4K20me1 (ChIP-Seq) at PARP-1 clusters (cluster 1=5385, cluster 2=2637, cluster 3=11, 920 regions) in human protein-coding genes. Signals extend from −1 kb of the TSS to +1 kb of the TES.