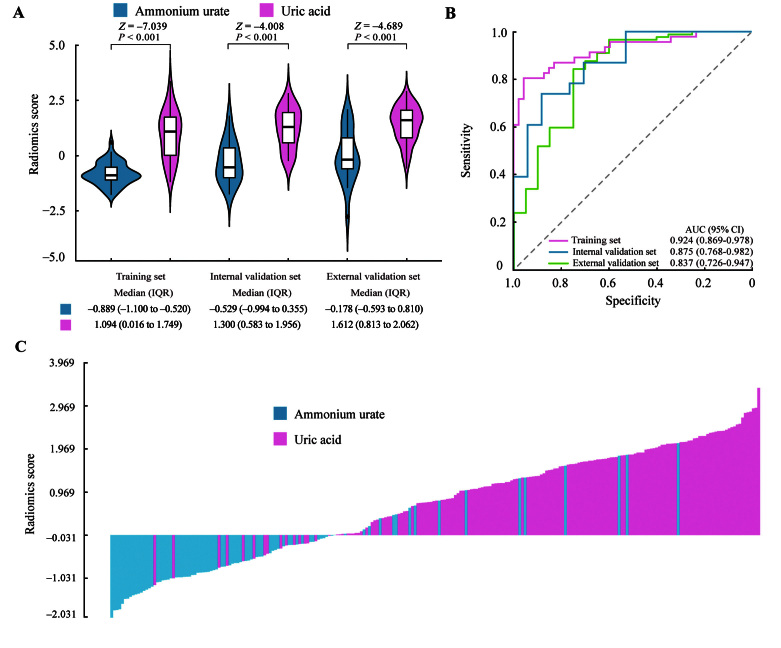
Figure 4.
Performance of the radiomics signature. (A) Boxplots of the radiomics score. (B) ROC curves of the radiomics signature. (C) Waterfall plot shows the distribution of radiomics score and stone composition in the combined training set and two validation sets. AUC: Area under the receiver operating characteristic curve; CI: Confidence interval; IQR: Interquartile range; ROC: Receiver operating characteristic.

