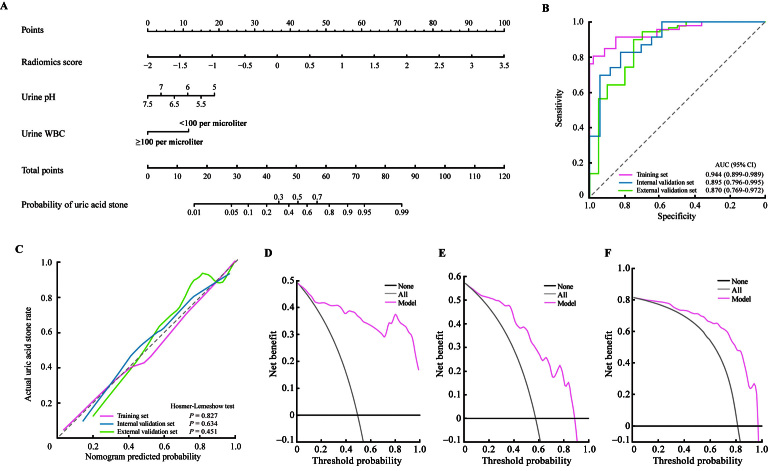
Figure 5.
Performance of the radiomics model. (A) The nomogram was constructed based on the radiomics model. (B) ROC curves of the radiomics model. (C) Calibration curve of the radiomics model. The dotted line represents perfect prediction. The calibration curve (solid line) has a closer fit to the dotted line, indicating a better calibration. (D–F) DCA curves of the radiomics model in the training set (D), internal validation set (E), and external validation set (F). The decision curve presents the net benefit vs. the threshold probability. The red line refers to the radiomics model. The gray line represents the hypothesis that all patients suffered from uric acid stones, while the black line represents the assumption that no patients had uric acid stones. CI: Confidence interval; DCA: Decision curve analysis; ROC: Receiver operating characteristic.

