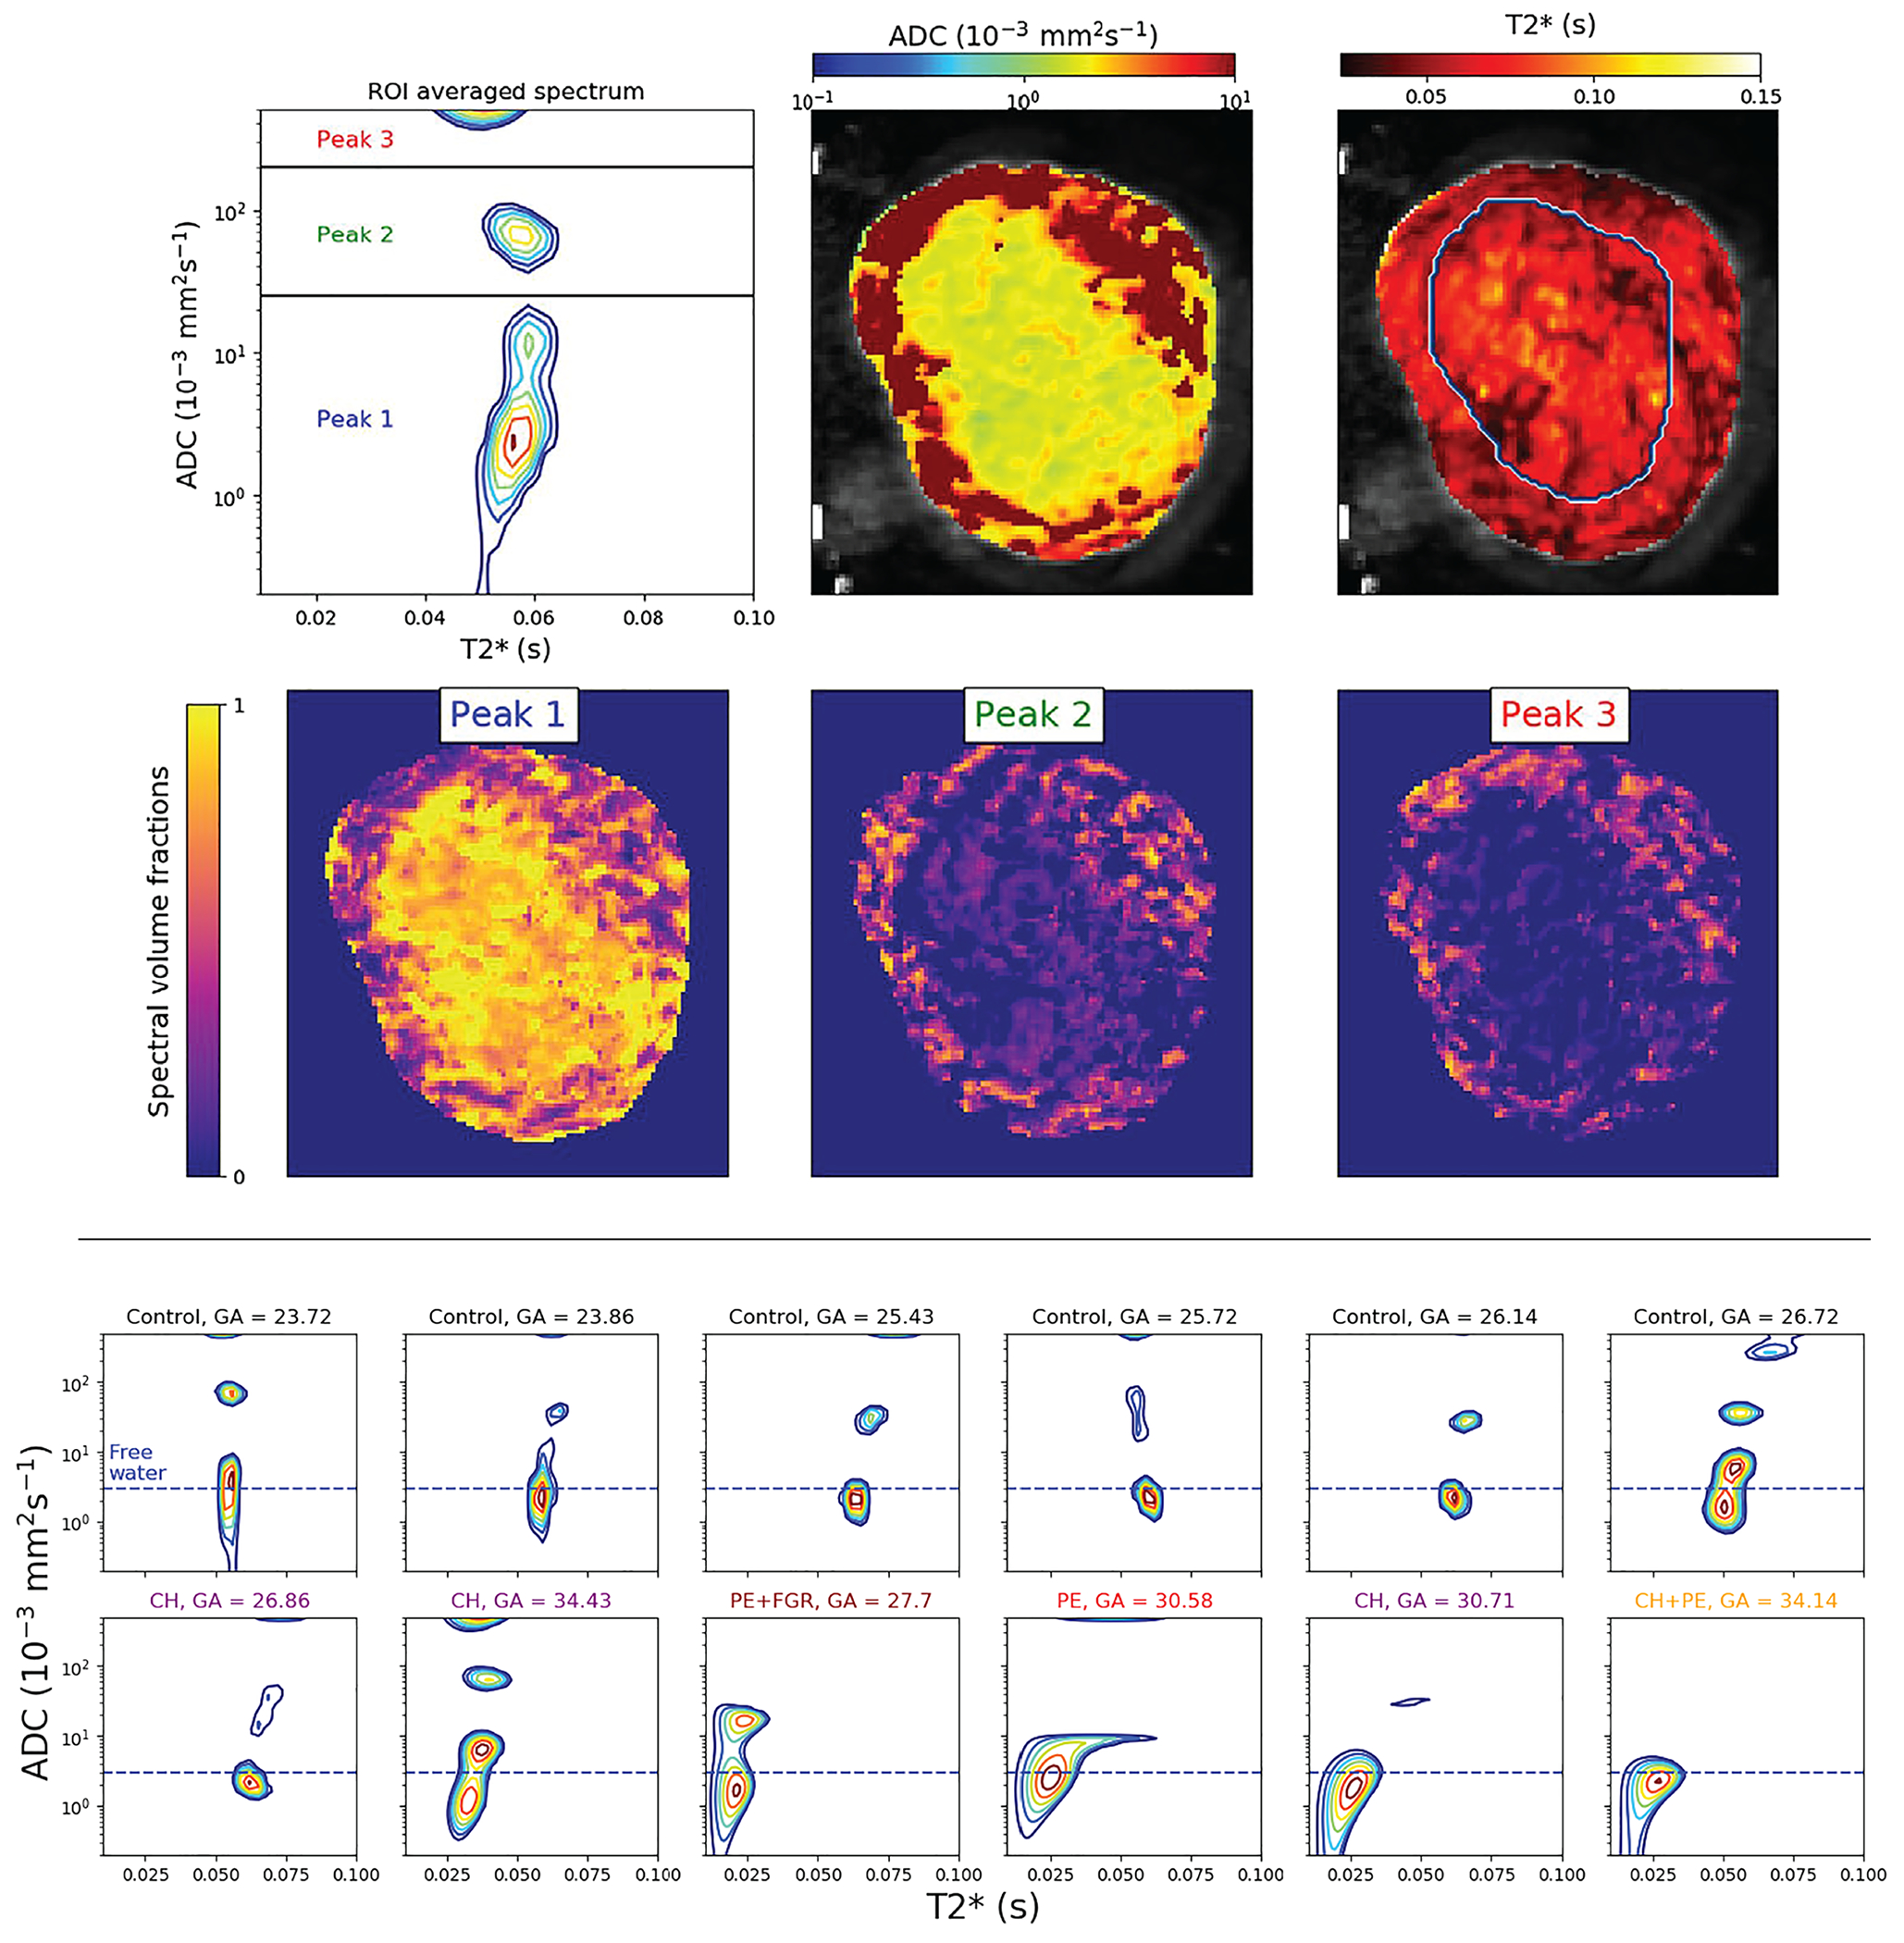
FIGURE 9.

spectra show anatomical specificity. Top panel: spectrum derived from spatially averaged signal from the entire placenta and uterine wall, with the three spectral regions that are integrated to generate the spatial SF maps below. Bottom panel: spectra derived from the spatially averaged signal of control and abnormal cases. Horizontal, dashed blue lines represent the approximate diffusivity of water in free media at 37°C. (GA, gestational age; CH, chronic hypertensive; PE, pre-eclampsia; FGR, fetal growth restriction). Adapted from the work of Slator et al86
