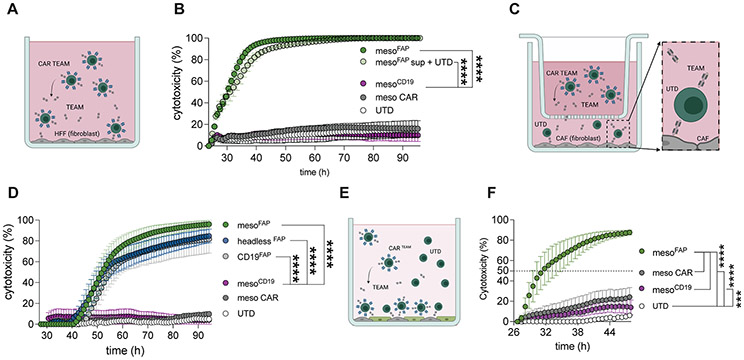
Figure 2. MesoFAP CAR T-cells or UTD mixed with FAP TEAM specifically eliminate FAP-expressing fibroblasts and are superior to CARs targeting mesothelin only in PDAC + CAF co-cultures.
A. Schematic of mesoFAP CAR T-cells targeting HFF fibroblasts. B. Real-time impedance-based cytotoxicity assay of sorted CARTEAM or UTDs with supernatant from mesoFAP CAR T-cells against FAP-expressing HFF using an effector to target ratio (E:T) of 1:1. C. Schematic of transwell system containing UTDs and CAFs in the bottom well and TEAM-secreting CAR T-cells in the upper well. D. Real-time impedance-based cytotoxicity assay of sorted CARTEAM in the transwell system with CAF-1 and UTD cells in the lower well, E:T = 1:1. E. Schematic of co-culture system containing target-cells CAF-1 and AsPC-1 in a 1:1 ratio treated with CAR or UTD as effector cells (E:T = 1:5 = 0.2 CAR : (1 CAF : 1 PDAC)). F. Real-time impedance-based killing assay in the co-culture system (CAFs and AsPC-1 in 1:1 ratio) treated with mesoFAP, mesoCD19, or anti-mesothelin CAR T-cells or UTD controls. All data are plotted as the mean +/−SEM. Stars indicate significance between biological triplicates assessed by one-way ANOVA and Dunnett’s multiple comparison post hoc analysis. ***p<0.001, ****p<0.0001. PDAC: pancreatic ductal adenocarcinoma, CAF: cancer-associated fibroblasts, UTD: untransduced T-cell. Schematics were created with BioRender.com.

