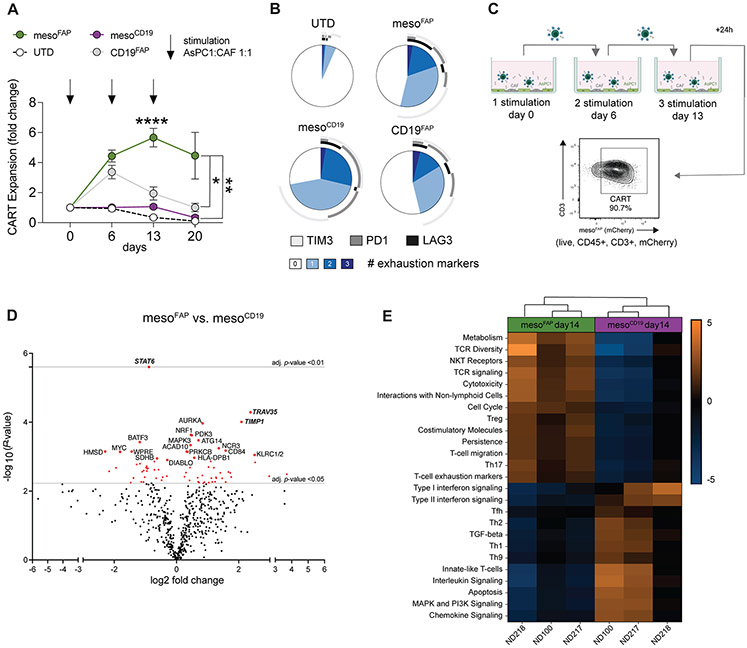
Figure 3. MesoFAP proliferate more in the presence of PDAC and CAF and demonstrate a different activation profile than control CAR T-cells.
A. Fold change in T-cell expansion when CARTEAM or UTD were repeatedly stimulated with AsPC-1 and CAF-1. (AsPC-1:CAF-1:T-cell ratio of 1:1:2). B. Exhaustion markers expressed by T-cells in the co-culture at day 13 as measured by flow cytometry. Data is from one representative donor. C. Schematic of co-culture set-up (created with BioRender.com). T-cells (live, CD45+, CD3+, and mCherry+) were sorted 24h after the 3rd stimulation (day 14) and RNA analysis was performed by NanoString. D. Volcano plot of differential RNA expression of flowcytometric sorted (expressing the same level of mCherry) mesoFAP CAR T-cells versus mesoCD19 CAR T-cells following co-culture with AsPC-1 and CAFs. The top 20 genes are annotated. The grey horizontal line indicates an adjusted p-value of 0.05 and 0.001. E. Pathway analysis of NanoString data comparing mesoFAP and mesoCD19 CAR T-cells from 3 independent healthy donors (ND218, ND210, and ND100). All data represent mean +/−SEM of at least biological triplicates. MFI-sorted CAR T cells or UTDs were added in biological triplicates per condition. Stars indicate significance as determined by one-way ANOVA and Dunnett’s multiple comparison post hoc analysis. *p < 0.05, **p < 0.01, ***p < 0.001 ****p < 0.0001, E:T = effector to target ratio. PDAC: pancreatic ductal adenocarcinoma, CAF: cancer-associated fibroblasts, UTD: untransduced T-cell, TEMRA: T-effector memory and CD45+/CCR7− subset, ND: normal donor.

