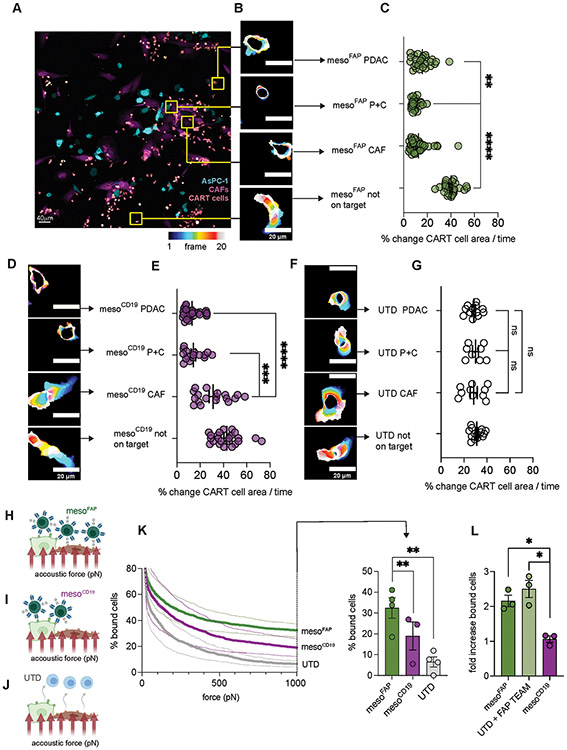
Figure 4. Live cell, time-lapse microscopy shows reduced edge dynamics and acoustic force microscopy reveals increased binding avidity of mesoFAP in comparison to controls.
A. Representative image of sorted mesoFAP CAR T-cells (pink/salmon) interacting with AsPC-1 (cyan), CAFs (magenta), or AsPC-1 and CAFs. B. Representative images visualizing edge dynamics (percentage change of CAR T-cell area over time) of mesoFAP CAR T-cells over 20 frames (frame 1 dark blue to frame 20 white). C. Percentage change of mesoFAP CAR T-cell area over time (number of cell interactions counted: PDAC, n=28; P+C, n=25; CAF, n=42; not on target, n=25). D,F. Representative images visualizing edge dynamics of D. mesoCD19 CAR T-cells or F. UTD T-cells. E,G. Percentage change of E. mesoCD19 CAR T-cells over time (number of cell interactions counted: PDAC, n=28; P+C, n=16; CAF, n=18; not on target, n=23) or G. UTDs over time (number of cell interactions counted: PDAC n=12; P+C, n=8; CAF, n=10; not on target, n=14). H-J. Schematic showing 1:1 ratio of AsPC-1 and CAFs in the flow chamber to measure cell binding of mesoFAP (H), mesoCD19 (I), and UTD (J) avidity by acoustic force microscopy (created with BioRender.com). K. Percentage of mesoFAP, mesoCD19, or UTD bound to 1:1 AsPC-1 and CAF mixture (left) with an increasing amount of acoustic force (pN) and (right) at 1000pN as measured by z-Movi. L. Fold increase of bound mesoFAP CAR T-cells or UTD cells with the addition of FAP-TEAM on HFF fibroblasts using z-Movi. All data represent mean +/−SEM. Representative images have been chosen within 1 standard deviation from the median. Results were obtained from biological duplicates, from at least 3 different locations on the slide. Stars represent significance as determined by unpaired two-tailed t-tests. *p < 0.05, **p < 0.01 ***p < 0.001****p < 0.0001. UTD: untransduced T-cell, pN: picoNewton, P+C: PDAC+CAF.

