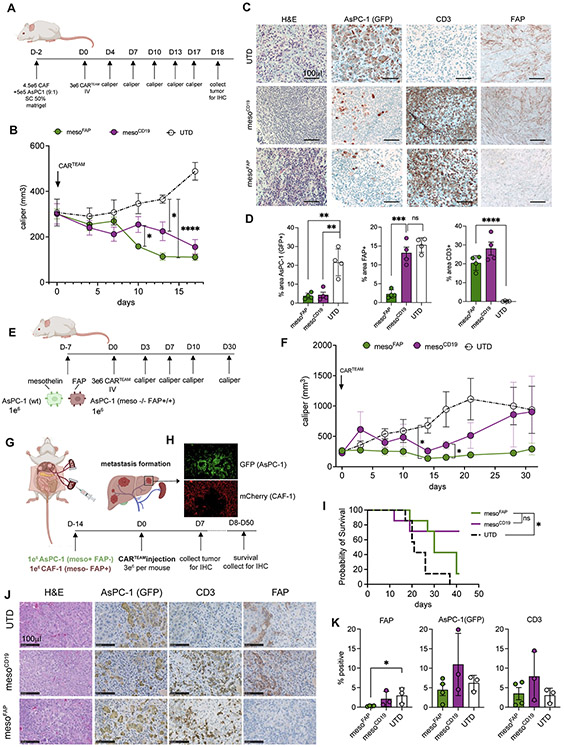
Figure 5. mesoFAP CAR T-cells are efficacious against PDAC and CAFs in vivo.
A. Schematic of experimental setup in which CAF-1 and AsPC-1 (9:1 ratio) were subcutaneously implanted in the flank of NSG mice. Mice were treated intravenously with UTD, mesoFAP, or mesoCD19 CAR T-cells 2 days after tumor-CAF implantation. B. Tumor volume over time as measured by caliper. C. Representative hematoxylin and eosin (H&E) staining and immunohistochemical (IHC) staining for GFP (AsPC-1), and CD3 (T-cells) on tumors harvested on day 18 from mice treated with UTD, mesoCD19 or mesoFAP CAR T-cells. D. Quantification of C as % area positive for each marker. E. Schematic of experimental setup with AsPC-1 and AsPC-1 mesothelin −/− FAP+ in a 1:1 ratio being subcutaneously implanted into the flank of NSG mice. Mice were treated intravenously with UTD, mesoFAP, or mesoCD19 CAR T-cells 7 days after tumor implantation. F. Tumor volume over time as measured by caliper. G. Schematic of experimental hemi-spleen model for liver metastasis. H. Representative immunofluorescence images of PDAC (AsPC-1 GFP+) and CAFs (mCherry+) metastasis in murine liver. I. Kaplan-Meier curve of survival cohort of mice (n=7 mice carried out through death). J. IHC representation of sequential cut slides from liver metastasis from mice sacrificed on day 21. K. Quantification of J as percent positive cell for each marker (n=3). Data represent mean +/−SEM. Stars indicate significance as determined by unpaired two-tailed t-tests. *p < 0.05, **p < 0.01, ***p < 0.001, ****p < 0.0001 (panels D and K). N=4-5 animals/group, repeated with T-cells from two healthy donors. Data represent two-way ANOVA with correction for multiple comparisons, individual p-values are indicated *p < 0.05, ****p < 0.0001 (panel B and F). Data represent survival analysis (Kaplan-Meier) individual p-values are indicated *p < 0.05, ns = not significant (panel I). Schematics were created with BioRender.com.

