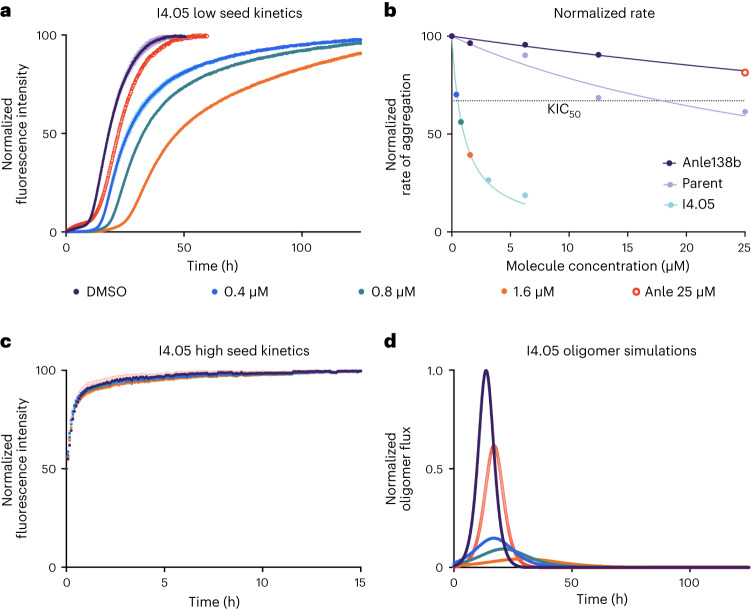
Fig. 2. Performance comparison of a molecule from the iterative learning (I4.05) versus an αS aggregation inhibitor currently in clinical trials (Anle-138b).
a, Kinetic traces of a 10 µM solution of αS with 25 nM seeds at pH 4.8, 37 °C in the presence of molecule or 1% DMSO (n = 3 replicates; central measure, mean; error, standard deviation (s.d.)). During the initial screening, except for iteration 4, all molecules were screened at 2.5 molar equivalents (25 µM), and potent molecules were then taken for further validation at lower concentrations: 0.4 µM (blue), 0.8 µM (teal), 1.6 µM (orange) with Anle-138b at 25 µM for comparison (red circles). The 1% DMSO negative control is shown in purple. Molecule I4.05 is shown as an example. The endpoints are normalized to the αS monomer concentration at the end of the experiment, which was detected via the Pierce BCA Protein Assay at t = 125 h. b, Approximate rate of reaction (taken as 1/t1/2, normalized between 0 and 100; central measure, mean) in the presence of three different molecules, Anle-138b (purple), parent structure 69 (lilac) and I4.05 (blue). The KIC50 of I4.05 is indicated by the intersection of the fit (blue) and the horizontal dotted line. c, High-seeded experiments (5 µM seeds, all other conditions match a, n = 3 replicates; central measure, mean; error, s.d.) were also carried out to observe any effects on the elongation rate and enable oligomer flux calculations in combination with the secondary nucleation rate derived from a. d, Oligomer flux calculations for I4.05 versus the clinical trial molecule Anle-138b using the rates derived from both a and c.

