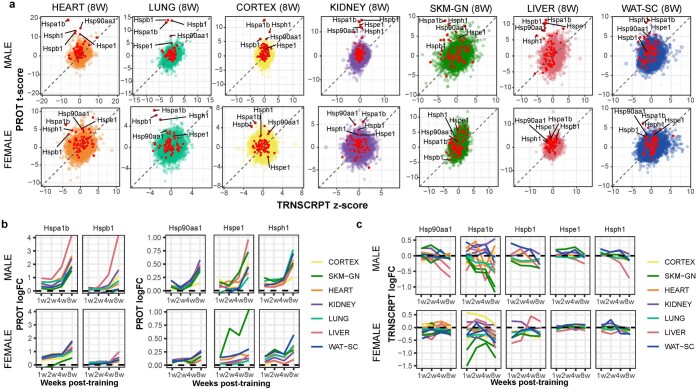
Extended Data Fig. 5. Heat shock response.
a) Scatter plots of the protein t-scores (PROT) versus the transcript z-scores (TRNSCRPT) by gene at 8 weeks of training (8 W) relative to sedentary controls. Data are shown for the seven tissues for which both proteomics and transcriptomics was acquired. Red points indicate genes associated with the heat shock response, and the labeled points indicate those with a large differential response at the protein level. b-c) Line plots showing protein b) and transcript (c) log2 fold-changes relative to the untrained controls for a subset of heat shock proteins with increased abundance during exercise training. Each line represents a protein in a single tissue.

