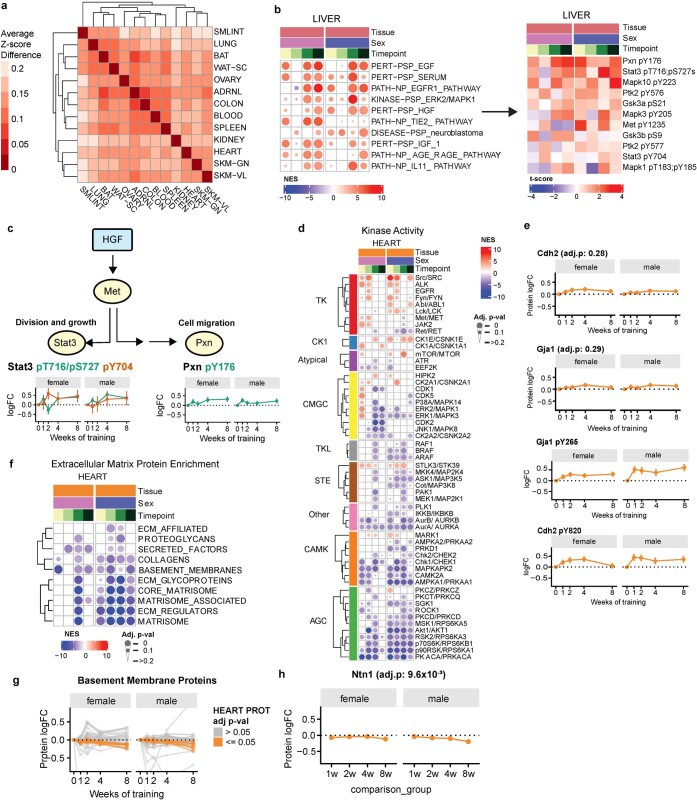
Extended Data Fig. 6. Regulatory signaling pathways modulated by endurance training.
a) Heatmap of differences in TF motif enrichment in training-regulated genes across tissues. Each value reflects the average difference in motif enrichment for shared transcription factors. Tissues are clustered with complete linkage hierarchical clustering. b) (left) Filtered PTM-SEA results for the liver showing kinases and signaling pathways with increased activity. (right) Heatmap showing t-scores for phosphosites within the HGF signaling pathway. c) Hypothetical model of HGF signaling effects during exercise training. Phosphorylation of STAT3 and PXN is known to modulate cell growth and cell migration, respectively. Error bars=SEM. d) Filtered PTM-SEA results for the heart showing selected kinases with significant enrichments in at least one time point. Heatmap shows the NES as color and enrichment p-value as dot size. Kinases are grouped by kinase family and sorted by hierarchical clustering. e) (top) Log2 fold-change of GJA1 and CDH2 protein abundance in the heart. No significant response to exercise training was observed for these proteins (F-test; q-value > 0.05). (bottom) Log2 fold-changes for selected Src kinase phosphosite targets, GJA1 pY265 and CDH2 pY820, in the heart. These phosphosites show a significant response to exercise training (F-test, 5% FDR). Error bars=SEM. f) Gene Set Enrichment Analysis (GSEA) results from the heart global proteome dataset using the matrisome gene set database. Heatmap shows NES as color and enrichment p-value as dot size. Rows are clustered using hierarchical clustering. g) Log2 fold-change for basement membrane proteins in heart. Proteins showing a significant response to exercise training are highlighted in orange (F-test; 5% FDR). Error bars=SEM. h) Log2 protein fold-change of NTN1 protein abundance in heart. A significant response to exercise training was observed for these proteins (F-test; 5% FDR). Error bars=SEM.

