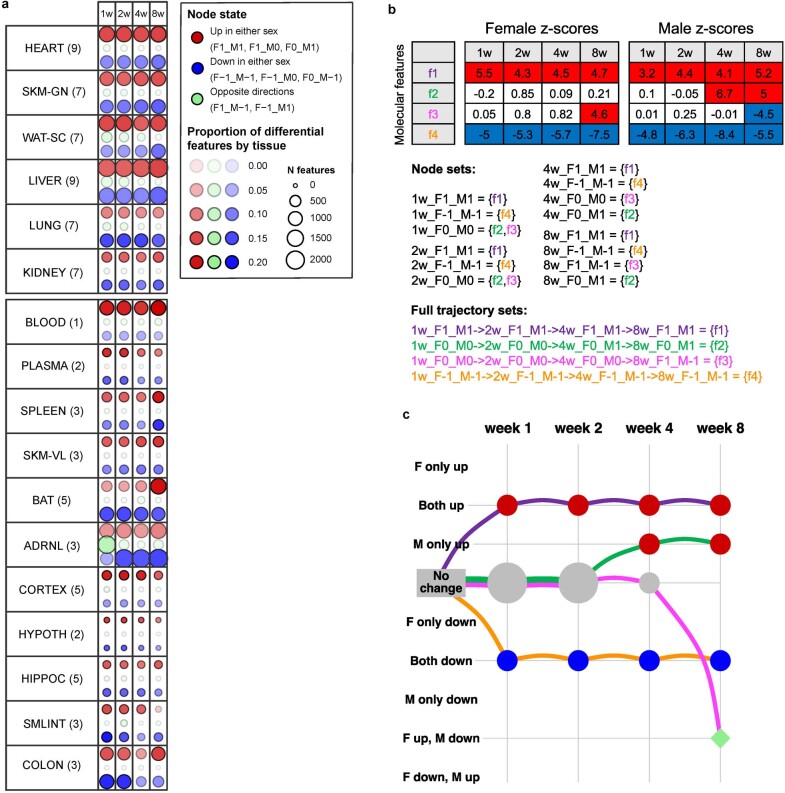
Extended Data Fig. 7. Graphical representation of differential results.
a) Number of training-regulated features assigned to groups of graphical states across tissues and time. Red points indicate features that are up-regulated in at least one sex (e.g., only in males: F0_M1; only in females: F1_M0; in both sexes: F1_M1), and blue points indicate features down-regulated in at least one sex (only in males: F0_M-1; only in females: F-1_M0; in both sexes: F-1_M-1). Green points indicate features that are up-regulated in males and down-regulated in females or vice versa (F-1_M1 and F1_M-1, respectively). Point size is proportional to the number of features. Point opacity is proportional to the within-tissue fraction of features represented by that point. Features can be represented in multiple points. The number of omes profiled in each tissue is provided in parentheses next to the tissue abbreviation. b) A schematic example of the graphical representation of the differential analysis results. Top: the z-scores of four features. A positive score corresponds to up-regulation (red), and a negative score corresponds to down regulation (blue). Bottom: the assignment of features to node sets and full path sets (edge sets are not shown for conciseness but can be easily inferred from the full paths). Node labels follow the [time]_F[x]_M[y] format where [time] shows the animal sacrifice week and can take one of (1w, 2w, 4w, or 8w), and [x] and [y] are one of (−1,0,1), corresponding to down-regulation, no effect, and up-regulation, respectively. c) Graphical representation of the feature sets. Columns are training time points, and rows are the differential abundance states. Node and edge sizes are proportional to the number of features that are assigned to each set.

