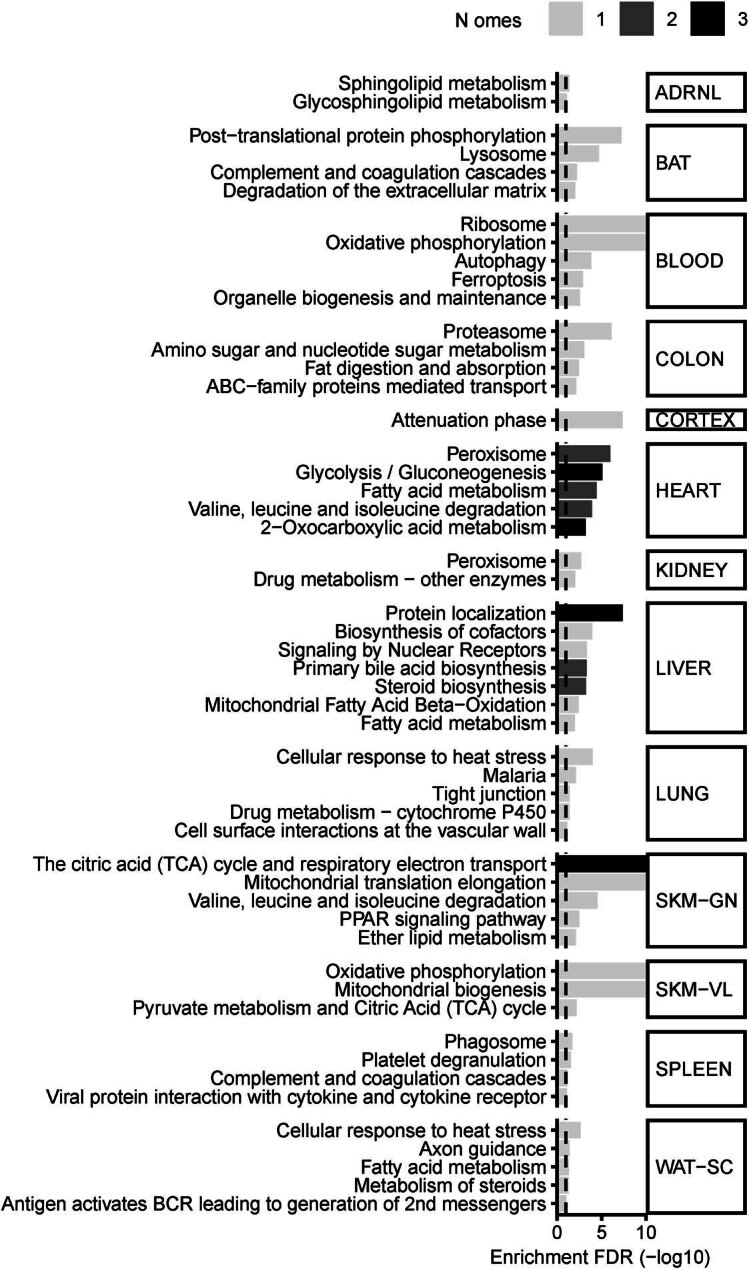
Extended Data Fig. 8. Key pathway enrichments per tissue.

Key pathway enrichments for features that are up-regulated in both sexes at 8 weeks of training in each tissue. For display purposes, enrichment q-values were floored to 1e-10 (Enrichment FDR (−log10) = 10). Bars are colored by the number of omes for which the pathway was significantly enriched (q-value < 0.01) (lighter gray: 1 ome; darker gray: 2 omes; black: 3 omes). Pathways were selected from Supplementary Table 10.
