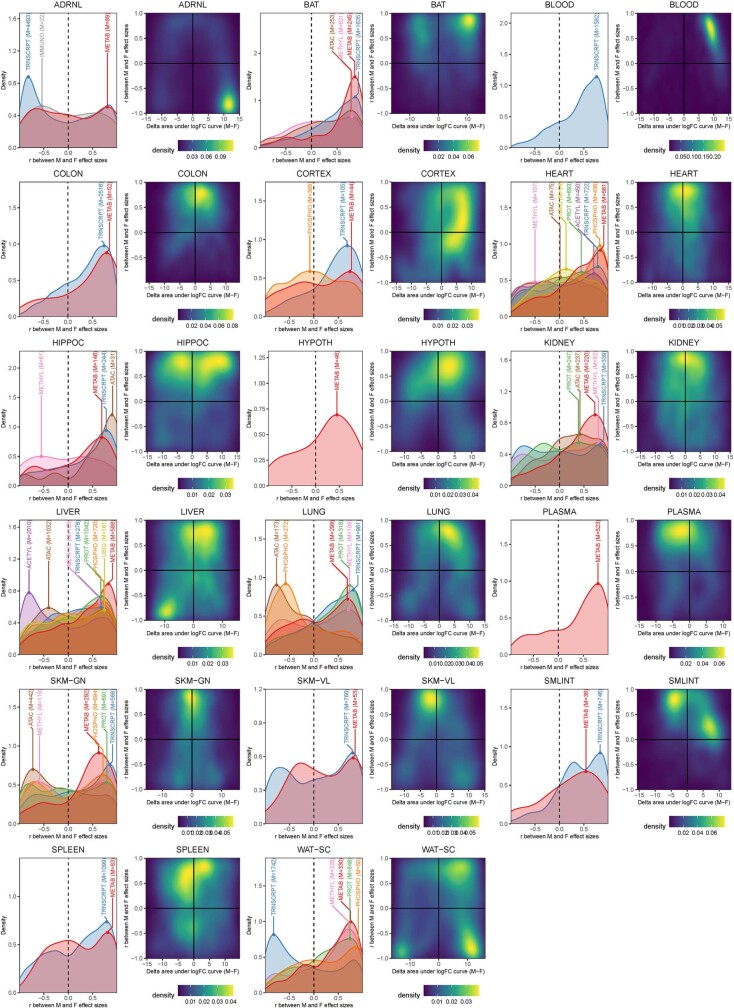
Extended Data Fig. 10. Characterization of the extent of sex difference in the endurance training response.
The extent of sex differences in the training response were characterized in two ways: first, by correlating log2 fold-changes between males and females for each training-differential feature; second, by calculating the difference between the area under the log2 fold-change curve for each training-differential feature, including a (0,0) point (ΔAUC, males - females). The first approach characterizes differences in direction of effect while the second approach characterizes differences in magnitude. Left plot for each tissue: density line plots of correlations from the first approach. Densities or correlations corresponding to features in each ome are plotted separately, with a label that provides the ome and the number of differential features represented. Right plot for each tissue: 2D density plot of ΔAUC against the correlation between the male and female log2 fold-changes for each training-differential feature used to simultaneously evaluate sex differences in the direction and magnitude of the training response. Points at the top-center of these 2D density plots represent features with high similarity between males and females in terms of both direction and magnitude; features on the right and left sides of the plots represent features with greater magnitudes of response in males and females, respectively.

