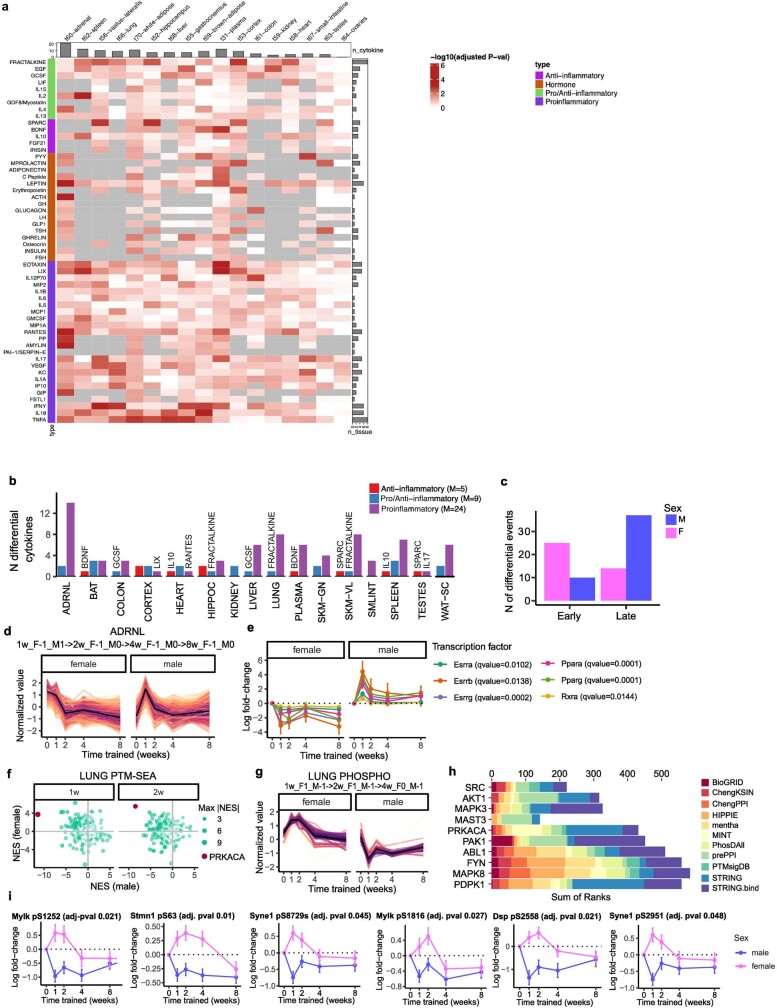
Extended Data Fig. 11. Sex differences in the endurance training response.
a) Heatmap of the training response of immunoassay analytes across tissues. Gray indicates no data. Bars indicate the number of training-regulated analytes in each tissue (top) and the number of tissues in which the analyte is training-regulated (right, 5% FDR). b) Training-differential cytokines across tissues. 5, 24, and 9 cytokines were annotated as anti-, pro-, and pro/anti- inflammatory, respectively. Bars indicate the number of annotated cytokines in each category that are differential (5% FDR). c) Counts of early vs. (1- or 2-week) vs. late (4- or 8-week) differential cytokines, according to states assigned by the graphical analysis, including all tissues. Cytokines with both early and late responses in the same tissue were excluded. d) Line plots of standardized abundances of training-differential features that follow the largest graphical path in the adrenal gland (i.e., 1w_F-1_M1 − >2w_F-1_M0 − >4w_F-1_M0 − >8w_F-1_M0 according to our graphical analysis notation). The black line represents the average value across all features. The closer a colored line is to this average, the darker it is (distance calculated using sum of squares). e) Line plots of transcript-level log2 fold-changes corresponding to six transcription factors (TFs) whose motifs are significantly enriched by transcripts in (d). TF motif enrichment q-values are provided in the legend (error bars = SEM). f) Male versus female NES from PTM-SEA in the lung. Anticorrelated points corresponding to PRKACA NES are in dark red. g) Line plots of standardized abundances of training-differential phosphosites that follow the largest graphical edges of phosphosites in the lung (1w_F1_M-1 − >2w_F1_M-1 − >4w_F0_M-1). h) Top ten kinases with the greatest over-representation of substrates (proteins) corresponding to training-differential phosphosites in (g). MeanRank scores by library are shown, as reported by KEA3. i) Line plots showing phosphosite-level log2 fold-changes of PRKACA phosphosite substrates identified in the lung as differential with disparate sex responses (error bars = SEM).

