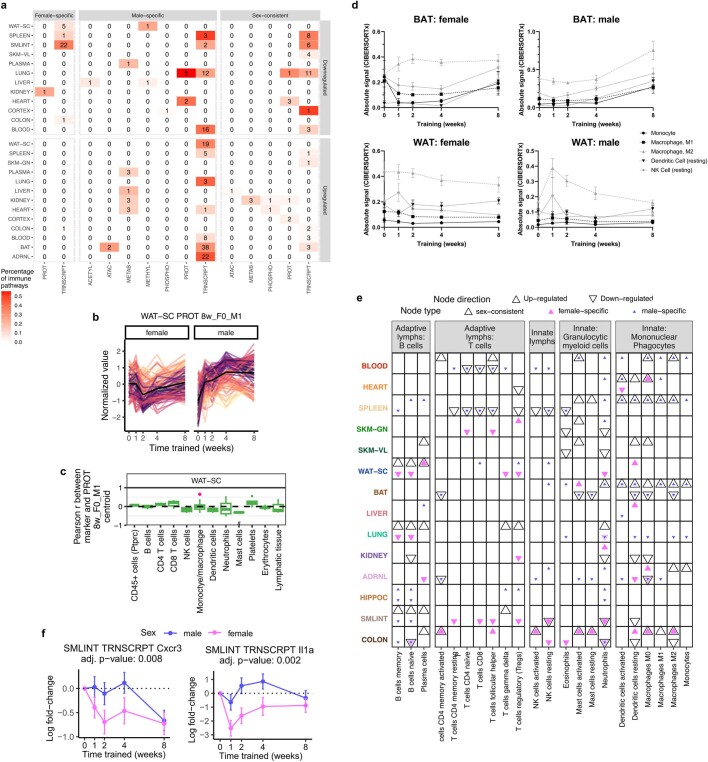
Extended Data Fig. 12. Assessment of immune responses to endurance training.
a) Heatmap of the number and percent of KEGG and Reactome immune pathways significantly enriched by training-regulated features at 8 weeks. b) Line plots of standardized abundances of training-differential proteins in white adipose tissue up-regulated only in males at 8 weeks. Black line shows average across all features. c) Boxplots of the sample-level Pearson correlation between markers of immune cell types, lymphatic tissue, or cell proliferation and the average value of features in (b) at the protein level. Center line represents median; box bounds represent 25th and 75th percentiles; whiskers represent minimum and maximum excluding outliers; filled dots represent outliers. A pink point indicates that the marker is also one of the differential features plotted in (b). # indicates when the distribution of Pearson correlations for a set of at least two markers is significantly different from 0 (two-sided one-sample t-test, 5% BY FDR). When only one marker is used to define a category on the y-axis, the gene name is provided in parentheses. d) Trajectories of mean absolute signal of various immune cell types in BAT or WAT-SC following deconvolution of bulk RNA-Seq with CIBERSORTx (error bars = SEM). e) Immune cell type enrichment analysis results of training-differentially expressed transcripts. Points represent significant enrichments (5% FDR, one-sided Mann-Whitney U test). f) Line plots showing the log2 fold-changes for Cxcr3 and Il1a transcripts in the small intestine (error bars = SEM).

