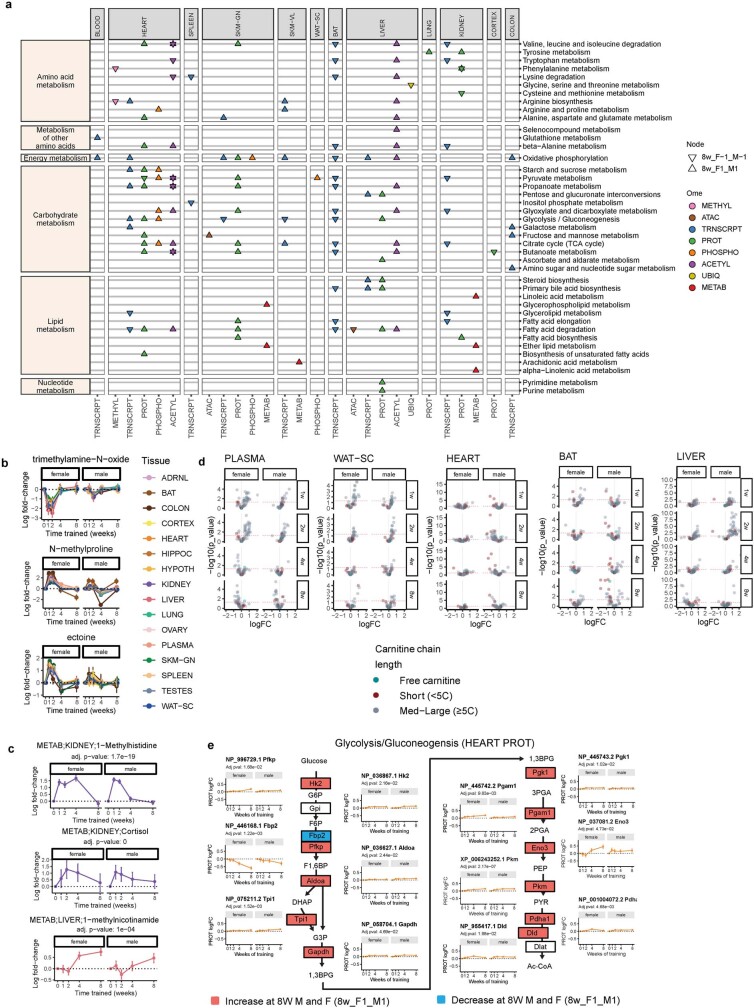
Extended Data Fig. 13. Metabolic effects of endurance training.
a) Significant enrichments for relevant categories of KEGG metabolism pathways from features that are up- or down- regulated in both sexes at 8 weeks (8w_F1_M1 and 8w_F-1_M-1 nodes, respectively). Triangles point in the direction of the response (up or down). Points are colored by ome. b) Log2 fold-change of metabolites regulated across many tissues (F-Test, 5% FDR, error bars=SEM). c) Log2 fold-change of training-regulated metabolites: 1-methylhistidine in the kidney, cortisol in the kidney, and 1-methylnicotinamide in the liver (F-Test, 5% FDR, error bars = SEM). d) Volcano plots showing abundance changes (log2 fold-changes; logFC) and significance (-log10 nominal p-values) for acyl-carnitines. Features are colored based on the carnitine chain length. e) Protein abundance changes in the glycolysis and gluconeogenesis pathway in the heart tissue after 8 weeks of training. Line plots show the log2 fold-changes over the training time course (error bars = SEM). Red and blue boxes indicate a statistically significant (F-test, 5% FDR) increase and decrease in abundance, respectively, for both males and females at 8 weeks.

