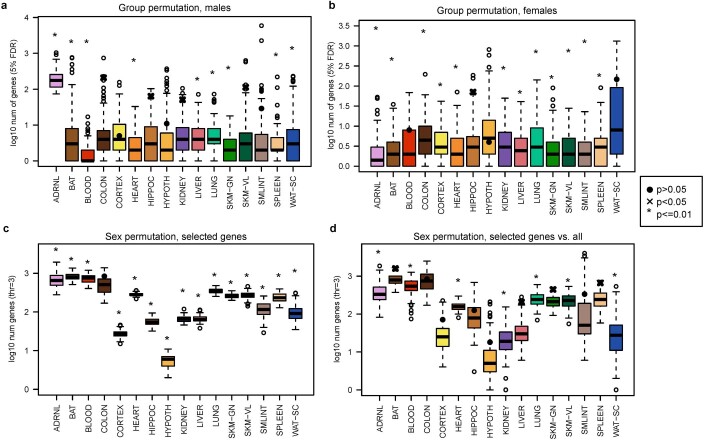
Extended Data Fig. 3. Permutation tests.
a-b) Permutation tests of groups within males (a) and females (b). For each sex, the original group labels were shuffled to minimize the number of animal pairs that remain in the same group. Only the group labels were shuffled and all other covariates remained as in the original data. For each permuted dataset, the differential abundance pipeline was rerun and the number of transcripts that were selected at 5% FDR adjustment were re-counted. c-d) Permutation tests of sex within groups. For each group and each sex, half of the animals were selected randomly and their sex was swapped. Only the sex labels were shuffled and all other covariates remained as in the original data. For each permutation the differential analysis pipeline was rerun and the timewise summary statistics were extracted. A gene was considered sexually dimorphic if for at least one time point the z-score (absolute) difference between males and females was greater than 3. c) Counts of sexually dimorphic genes among the IHW-selected genes of the original data. d) Counts of sexually dimorphic genes among the 5% FDR selected genes within each permuted dataset. Each boxplot in (a-d) represents the differential abundance analysis results over 100 permutations of the transcriptomics data in a specific tissue. Center line represents median; box bounds represent 25th and 75th percentiles; whiskers represent minimum and maximum excluding outliers; open circles represent outliers. Added points represent the results of the true data labels, and their shape corresponds to the empirical p-value (●: p > 0.05; ×: 0.01 < p < 0.05; *: p ≤ 0.01).

