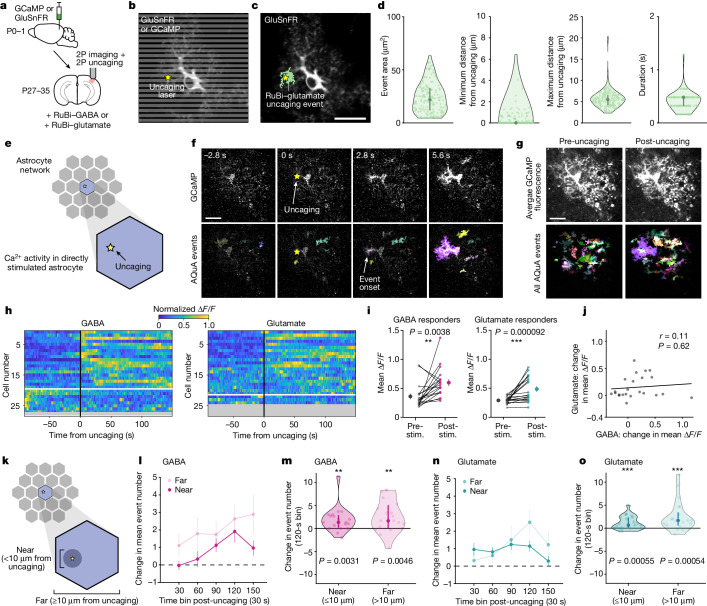
Fig. 2. Subcellular, spatiotemporally restricted NT release increases Ca2+ activity within directly stimulated astrocytes.
a, Experimental strategy for simultaneous ex vivo two-photon imaging of astrocyte Ca2+ (cyto-GCaMP6f) or extracellular glutamate (GluSnFR) and two-photon NT uncaging. b, Imaging and uncaging schematic. Grey lines: scanning laser. Yellow star: NT uncaging site. c, A representative GluSnFR event during RuBi–glutamate uncaging. d, GluSnFR event features post RuBi–glutamate uncaging. Data shown by individual glutamate events; median and 25th and 75th percentiles (n = 72 trials, 12 recordings, 4 slices, 2 mice). e, Schematic highlighting directly stimulated astrocyte. Analysis throughout figure includes only events from directly stimulated cells. f, Representative GCaMP6f fluorescence in astrocyte before and after RuBi–GABA uncaging. Yellow star: uncaging location and frame. g, Average GCaMP fluorescence 150–0 s pre- and 0–150 s post-stimulus from the astrocyte in f. h, Astrocyte Ca2+ stimulated by GABA or glutamate uncaging. Rows: average ΔF/F from AQuA-detected events per cell, normalized between 0 and 1 per cell. Cells sorted by onset time. Red line: NT uncaging. The white line separates responding (above) and non-responding cells (below). Responder cells: ≥1 post-stimulus frame with ∆F/F ≥ baseline mean + 3 s.d. Greyed-out rows: cells excluded because of baseline event frequency. i, Mean fluorescence pre- and post-stimulus from astrocytes responding to NT uncaging. Data are shown by cell and as mean ± s.e.m. j, Fluorescence change in stimulated astrocytes following NT uncaging. Pearson’s correlation shows no significant relationship between fluorescence change following GABA and glutamate uncaging (P = 0.62). k, A schematic of stimulated astrocyte compartments near and far from uncaging. Far compartment: uncaging outside NT spread radius (d, maximum distance from uncaging). l,n, Event frequency (events per 30 s) change near and far from GABA (l) and glutamate (n) uncaging within responding, stimulated cells. Data shown as mean ± s.e.m. m,o, Event frequency change during high activity period (90–120 s after uncaging, ‘120-s’ bin) from l and n, respectively. Data shown by cell; median and 25th and 75th percentiles. h–j,l–o, Pre-stimulus: 90–0 s before uncaging; post-stimulus: 0–150 s following uncaging. n = 27 (GABA) and 24 (glutamate) cells in h, 19/27 cells responded to GABA and 21/24 to glutamate in i,l–o and 24 paired cells in j all from 27 FOVs, 7 slices, 4 mice. i,m,o, Wilcoxon signed-rank test. All statistical tests are two-sided. Scale bars, 20 μm (c,f,g). NS: P ≥ 0.05; *P < 0.05; **P < 0.01; ***P < 0.001.

