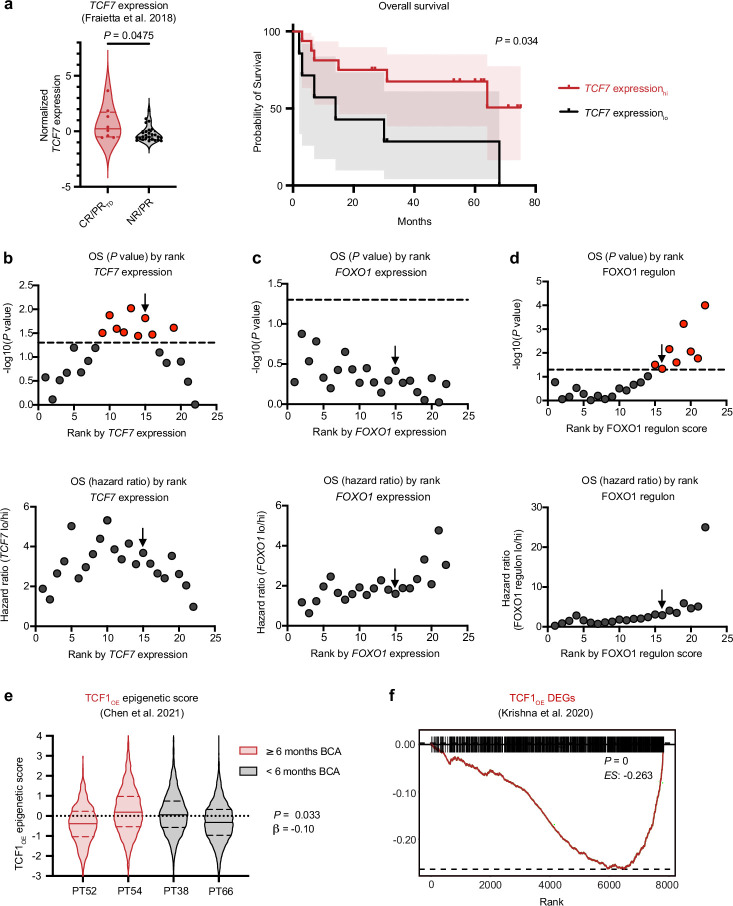
Extended Data Fig. 10. Endogenous TCF7 transcript and FOXO1 regulon, but not TCFOE transcriptional or epigenetic signatures, predict CAR T cell and TIL responses in patients.
a, ssGSEA on RNA-seq from CAR-stimulated CTL019 cells2 (complete responder, CR, partial responder with transformed disease, PRTD, n = 3; partial responder, PR, n = 5; non-responder, NR, n = 21). Enrichment score stratification points for patient survival analyses were determined using previously published methods60. a, TCF7 expression is shown for patient outcomes (left) and overall survival (right). b–d, P values (top) and hazard ratios (bottom) of different stratification points in relation to overall survival (OS) of TCF7 expression (b), FOXO1 expression (c) and FOXO1 regulon (d). Dotted lines are drawn at P < 0.05 and black arrows indicate the stratification points used. e, An epigenetic signatured derived from CD8+ CD19.28ζ FOXO1OE bulk ATAC-seq data was applied to pre-manufactured paediatric CAR T cell single-cell ATAC-seq data5. Violin plots show TCF1OE epigenetic signature scores for patients with durable (Patient 52, n = 616 cells; Patient 54, n = 2959 cells) and short (Patient 38, n = 2093 cells; Patient 66, n = 2355 cells) CAR T cell persistence. f, GSEA was performed with CD8+ HA.28ζ TCF1OE DEGs and DEGs derived from CD39−CD69− patient TILs in adult melanoma8. Violin plots in a,e show minima and maxima; centre lines represent mean; dashed lines represent top and bottom quartiles. Statistical comparisons were performed using two-tailed Mann–Whitney test (a, left), log-rank Mantel–Cox test (a, right), two-sided Wald test (e), and two-sided Kolmogorov–Smirnov test (f).

