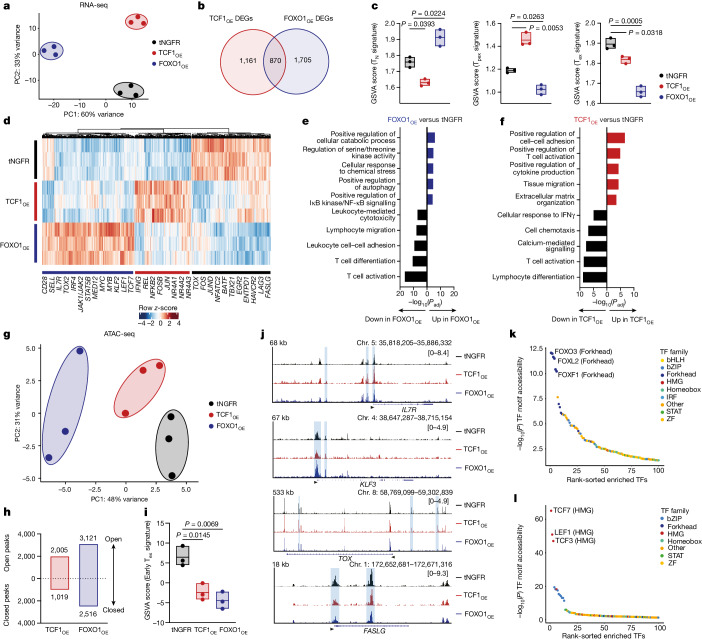
Fig. 2. Overexpression of FOXO1, but not TCF1, induces transcriptional and epigenetic features of T cell memory.
a–l, Bulk RNA-seq (a–f) and ATAC-seq (g–l) in tNGFR+CD8+ HA.28ζ CAR T cells (n = 3 donors). a, RNA-seq PCA. b, Venn diagram showing unique and shared DEGs in TCF1OE and FOXO1OE compared with tNGFR (Bonferroni-adjusted P < 0.05 with abs(log2(FC) > 0.5). c, GSVA of DEGs using naive (TN), Tpex and exhausted (Tex) T cell signatures55. Centre line represents mean score. d, Heat map and hierarchical clustering of DEGs. Genes of interest are highlighted. The colour bar shows normalized z-scores for each DEG. e,f, GO term analyses showing curated lists of the top upregulated and downregulated processes in FOXO1OE (e) and TCF1OE (f) versus tNGFR (Benjamini–Hochberg-adjusted P). g, ATAC-seq PCA. h, Number of differentially accessible peaks compared with tNGFR (P < 0.05 with abs(log2FC) > 0.5). i, GSVA of differentially accessible peaks using an early Tex cell epigenetic signature9. Centre line represents mean score. j, Chromatin accessibility tracks for the IL7R, KLF3, TOX and FASLG loci, for one representative donor. k,l, Rank-ordered plots of differentially accessible transcription factor (TF)-binding motifs in FOXO1OE (k) and TCF1OE (l) versus tNGFR. ZF, zinc-finger. Statistical comparisons were performed using DESeq2 (b,d,h,k,l), one-sided hypergeometric test (e,f) and repeated-measures one-way ANOVA with Dunnett’s test (c,i).

