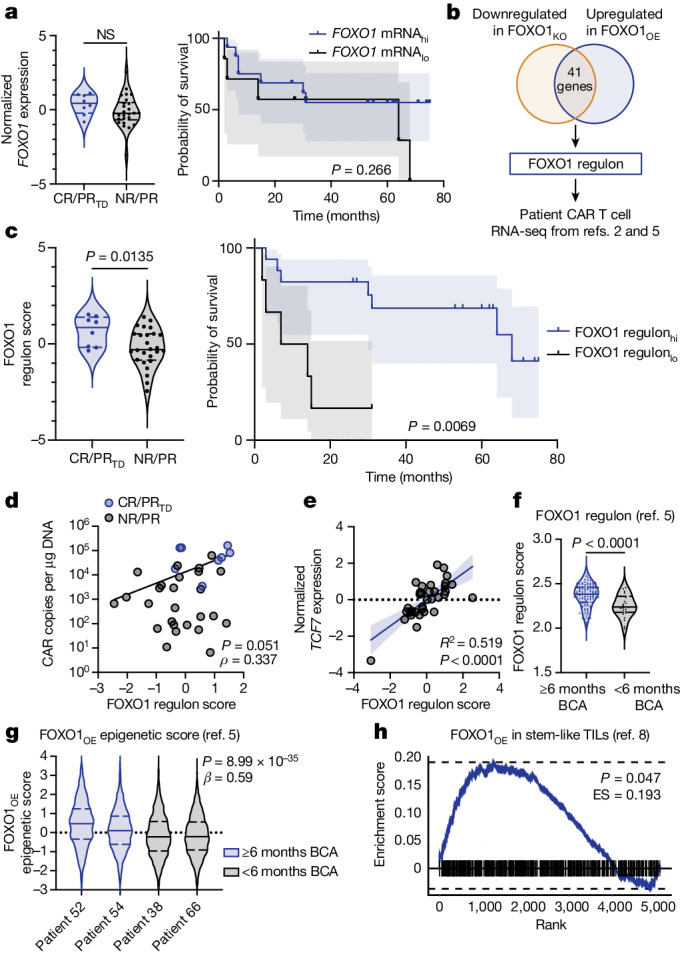
Fig. 5. FOXO1 activity correlates with clinical responses to CAR T cell and TIL therapies.

a–e, Single-sample gene set enrichment analysis (ssGSEA) on RNA-seq from pre-infusion, CAR-stimulated CTL019 cells from patients with CLL2 (complete responder (CR), n = 5; partial responder with transformed disease (PRTD), n = 3; partial responder (PR), n = 5; non-responder (NR), n = 21). a, FOXO1 ssGSEA for patient outcomes (left) and overall survival (right). b, The FOXO1 regulon was generated using FOXO1KO and FOXO1OE bulk RNA-seq data and then applied to published datasets2,5; n = 3 donors. c, FOXO1 regulon ssGSEA (data from ref. 2) for patient outcomes (left) and overall survival (right). d, Least squares regression (dark line) of FOXO1 regulon score and peak CAR T cell expansion. e, Simple linear regression (dark line) of TCF7 expression and FOXO1 regulon score. Dark lines in a,c represent patient survival curves and shaded areas in a,c,e represent 95% confidence intervals. Dots in d,e represent individual samples (blue, CR/PRTD; grey, NR/PR). f, FOXO1 regulon ssGSEA for pre-manufactured effector T cells from paediatric patients with B-ALL with durable (six or more months of B cell aplasia (BCA); n = 33 patients) or short (less than six months of BCA; n = 27 patients) CAR T cell persistence5. g, An epigenetic signature derived from FOXO1OE ATAC-seq was applied to pre-manufactured T cell single-cell ATAC-seq data from paediatric patients5. Data show FOXO1OE epigenetic signature scores for patients with durable (patient 52, n = 616 cells; patient 54, n = 2,959 cells) and short (patient 38, n = 2,093 cells; patient 66, n = 2,355 cells) CAR T cell persistence. h, GSEA using FOXO1OE DEGs and DEGs derived from CD39−CD69− TILs from adult patients with melanoma8. ES, enrichment score. Violin plots in a,c,f,g show minima and maxima; solid lines represent the mean and long dashed lines represent the top and bottom quartiles. Statistical comparisons were performed using two-tailed Mann–Whitney test (a, left; c, left; f), log-rank Mantel–Cox test (a, right; c, right), Spearman correlation (d,e), two-sided Wald test (g) and two-sided Kolmogorov–Smirnov test (h).
