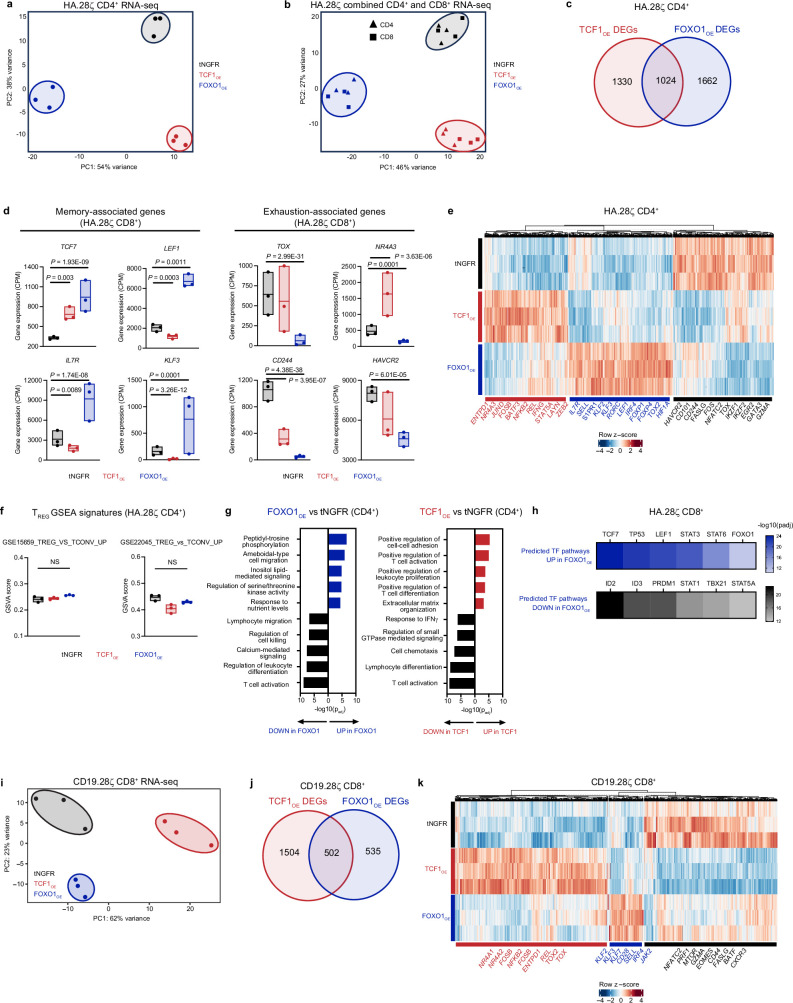
Extended Data Fig. 4. Overexpression of FOXO1 induces a memory-like transcriptional program in CAR T cells.
a–g, Bulk RNA-seq analyses of day 15 tNGFR+ CD4+ HA.28ζ CAR T cells overexpressing tNGFR, TCF1OE, or FOXO1OE (n = 3 donors). a, PCA of CD4+ cells. b, PCA that includes CD4+ samples plotted in a and CD8+ samples plotted in Fig. 2a. c, Venn diagram showing the number of unique and shared DEGs in CD4+ TCF1OE and FOXO1OE cells compared to tNGFR cells (Bonferroni-adjusted P < 0.05 with abs(log2FC)>0.5). d, Expression of memory- and exhaustion-associated genes. Centre line represents the mean counts per million. e, Heat map and hierarchical clustering of DEGs. Genes of interest are shown. Scale shows normalized z-scores for each DEG. f, GSVA using published human CD4+ regulatory T cell (Treg) signatures42,43. Centre line represents mean score. g, GO term analyses showing curated lists of top up- and downregulated processes in CD4+ FOXO1OE and TCF1OE cells versus tNGFR cells. Data show Benjamini–Hochberg-adjusted P. h, QIAGEN IPA of upregulated and downregulated TF pathways in FOXO1OE cells versus tNGFR cells. Data show adjusted P. i–k, Bulk RNA-seq analyses of day 15 tNGFR+ CD8+ CD19.28ζ cells overexpressing tNGFR, TCF1OE, or FOXO1OE (n = 3 donors). i, PCA analysis. j, Venn diagram showing the number of unique and shared DEGs in TCF1OE and FOXO1OE cells compared to tNGFR cells (Bonferroni-adjusted P < 0.05 with log2(fold change) < 0.5). k, Heat map and hierarchical clustering of DEGs. Genes of interest are shown. Scale shows normalized z-scores for each DEG. Statistical comparisons were performed using DESeq2 (c,d,e,j,k), repeated-measures one-way ANOVA with Tukey’s test (f) and one-sided hypergeometric test (g). NS, not significant.

