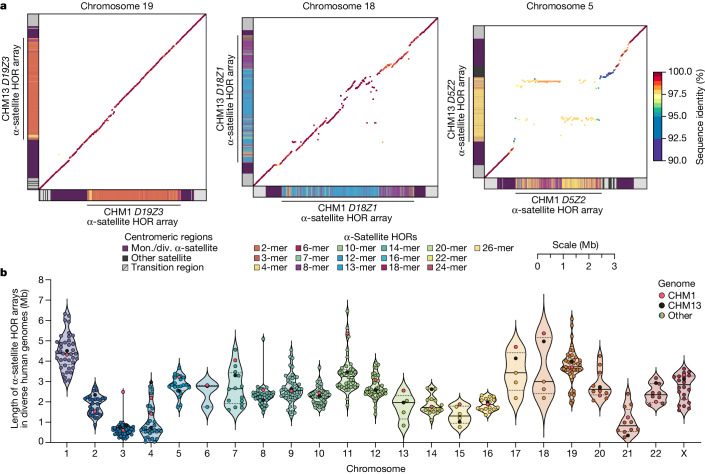
Fig. 2. The variation in sequence and structure between two sets of human centromeres.
a, The allelic variation between CHM1 and CHM13 centromeric/pericentromeric haplotypes. Diagonal lines are coloured according to per cent sequence identity. The α-satellite HOR array structure is shown on the axes, along with the organization of each centromeric/pericentromeric region. b, The length of the active α-satellite HOR arrays among the CHM1 (red), CHM13 (black) and complete HPRC/HGSVC (various colours) centromeres. n = 626. The α-satellite HOR arrays range in size from 0.03 Mb on chromosome 4 to 6.5 Mb on chromosome 11. Data are mean (solid black bar) and 25% and 75% quartiles (dotted black bars).

