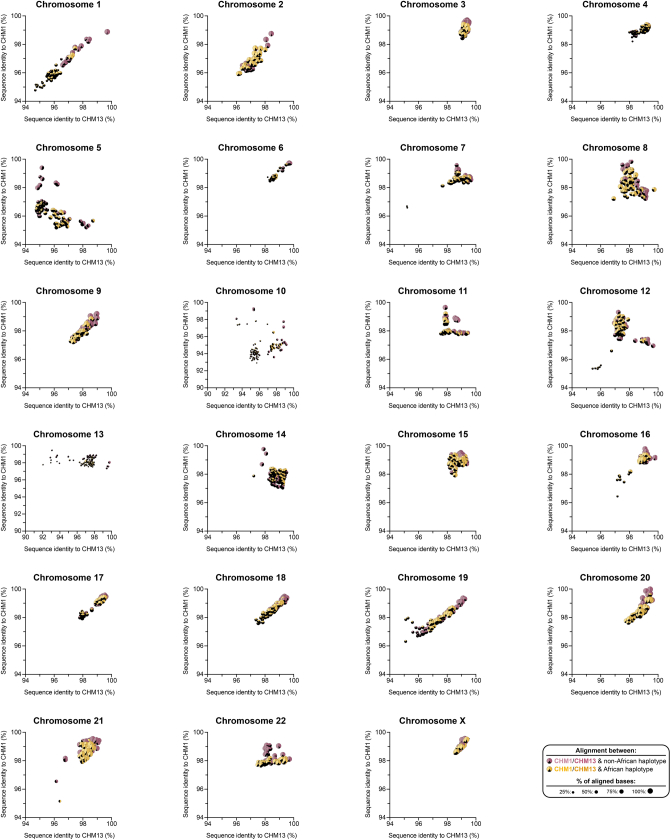
Extended Data Fig. 1. Variation in the sequence and structure of centromeric α-satellite higher-order repeat (HOR) arrays among 56 diverse human genomes.
Plots showing the percent sequence identity between centromeric α-satellite HOR arrays from CHM1 (y-axis), CHM13 (x-axis), and 56 other diverse human genomes [generated by the Human Pangenome Reference Consortium (HPRC)10 and Human Genome Structural Variation Consortium (HGSVC)23]. Each data point shows the percent of aligned bases from each human haplotype to either the CHM1 (left) or CHM13 (right) α-satellite HOR array(s). The percent of unaligned bases are shown in black. The size of each data point corresponds to the total percent of aligned bases among the CHM1 and CHM13 centromeric α-satellite HOR arrays. Precise quantification of the sequence identity and proportion of aligned versus unaligned sequences is provided in Supplementary Table 6. Enlarged versions of these plots are shown in Supplementary Figs. 14, 15.

