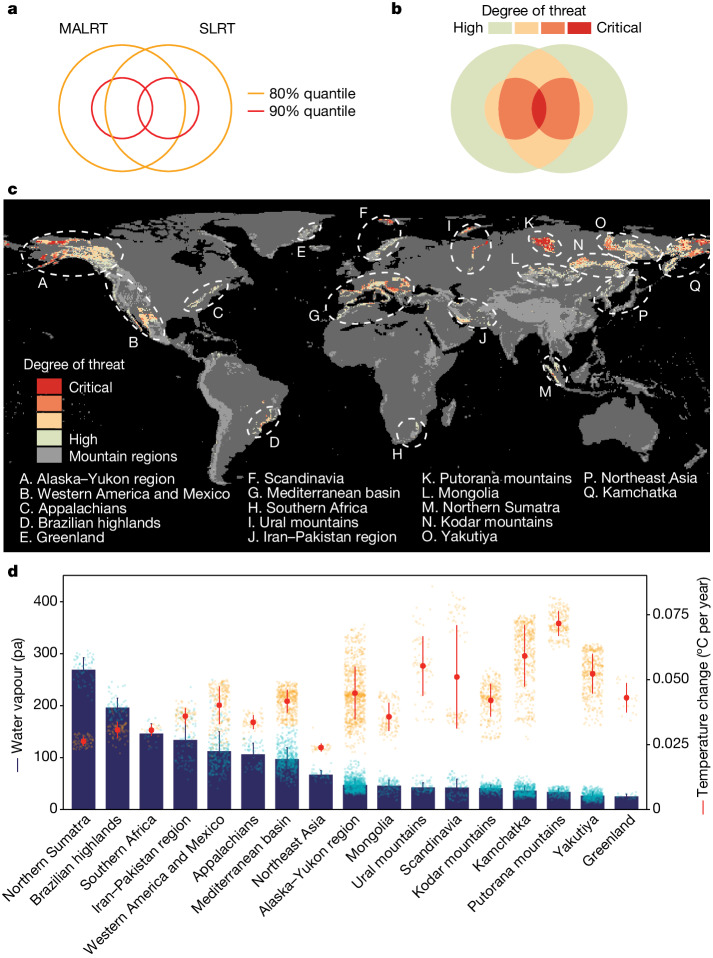
Fig. 3. Identifying mountain regions threatened by high vertical velocities of isotherm shifts and underlying mechanisms.
Consensus map of the vertical velocities of isotherm shifts as estimated from the SLRT or from the MALRT (see Fig. 2). a–c, Mountain regions in which velocities are greater than the 80% quantile (that is, retaining 20%) in the calculation of either the MALRT or the SLRT are labelled as critically threatened (a,b) and displayed in red (c). d, Orange points and segments represent the mean annual temperature change between the periods 1971–1980 and 2011–2020; blue bars represent the mean water vapour pressure during 2011–2020 for each of the 17 mountain regions affected by relatively fast vertical velocities of isotherm shifts. Error bars represent s.d. See Supplementary Data 1 and ‘Data availability’ for a comprehensive breakdown for each region, including sample size information. Considering that near-zero SLRT values result in extremely high climate velocity, we removed 1% outliers that are close to zero in c. Data with alternative levels of outlier removal (0.5%, 2% and 5%) are shown in Supplementary Fig. 2. Supplementary Data 3 provides a high-resolution map.

