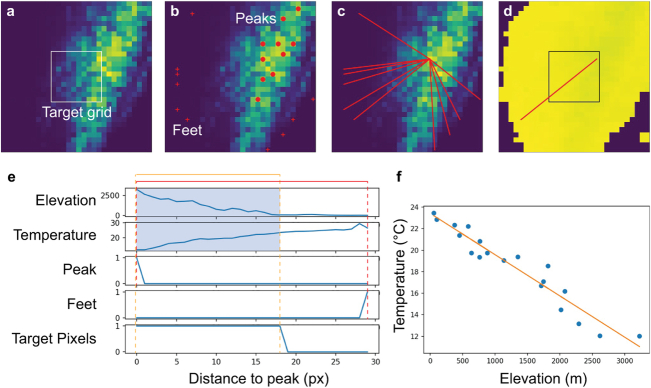
Extended Data Fig. 1. Diagram illustrating the calculation of SLRT.
a, 10 × 10 grids (all at 0.05-degree spatial resolution) of the DEM were included in a target grid (0.5-degree spatial resolution). b, Mountain peaks and feet/valleys are automatically searched and identified. c, A transect can be defined by a peak-foot/valley pair. d, An exemplar transect on the land surface temperature map (at 0.05-degree spatial resolution). e, The elevation and the mean annual temperature data across 2011–2020 along the exemplar transect are specified. f, The relationship between mean annual temperature and elevation. The data points were extracted according to e. The regression line is provided as the orange solid line, where the slope (beta in the regression model) is considered as the lapse rate of a transect.

