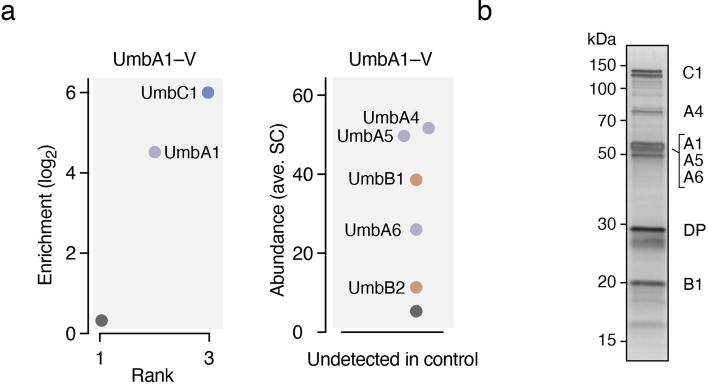
Extended Data Fig. 5. Purification of the Umb1 complex using epitope-tagged UmbA1.
a, IP-MS identification of proteins that interact with UmbA1-VSV-G. Left panel indicates the average fold enrichment of proteins detected in both IP and control samples; right panel presents abundance (average spectral counts, SC) for proteins detected only in IP samples. Colours indicate paralogous proteins and correspond to Fig. 2; non-Umb proteins shown in grey, (n = 2 independent experiments). b, Silver-stained SDS-PAGE analysis of the Umb1 particle preparation employed in structural analysis, purified using UmbA1–8xHis, with bands corresponding to individual Umb1 proteins identified. DP, degradation product. The experiment is representative of >5 independent replicates.

