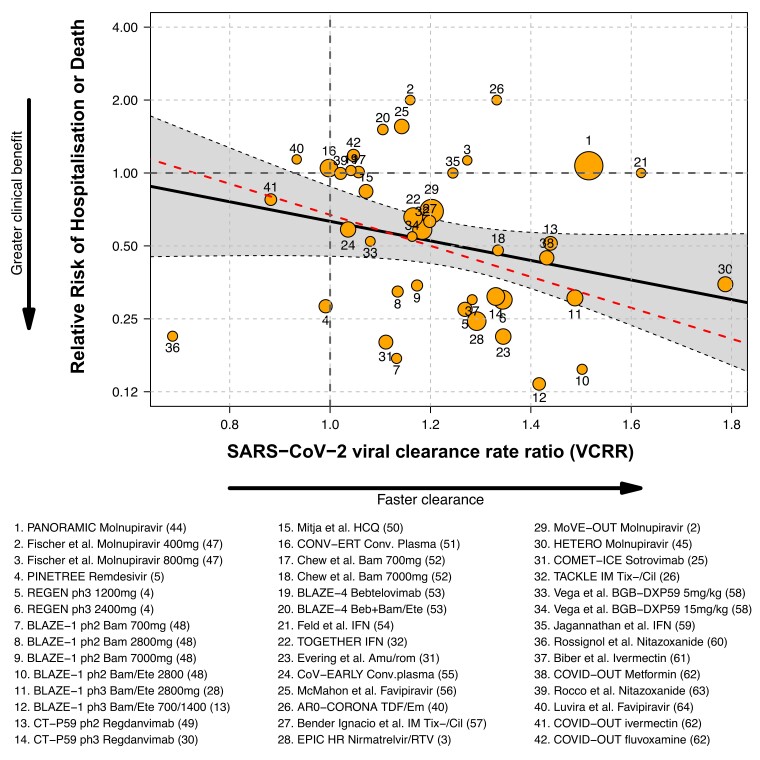
Figure 3.
Meta-regression analysis of the relationship between SARS-CoV-2 rate of clearance relative to control (VCRR), and relative risk of hospitalization/death. Each study is labelled with a number (Table S7). The area of the circles is proportional to the inverse of the standard error of the clinical effect size. Solid black line: regression analysis including all 32 eligible studies.2–5,13,25,26,28,30–32,40,44,45,47–64 Red dashed line: exclusion of the large PANORAMIC study (label 1).25

