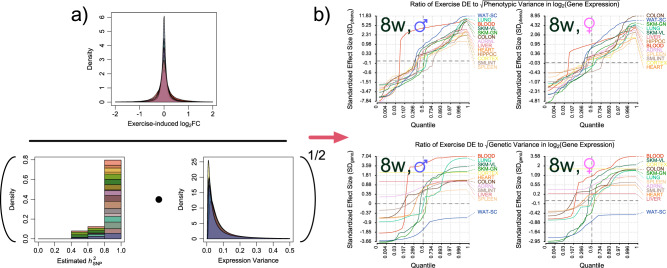
Fig. 2. Tissue-specific differential gene expression from exercise can exceed natural variation.
In this figure we visualize the procedure used to obtain Standardized Effect Sizes. In the numerator of (a) lies a truncated kernel density estimate of the distribution of log2FCs induced by exercise at the 8w timepoint. A stacked histogram of estimates for for expression scores from GTEx (p < 0.10 after IHW correction) is on the left in the denominator. On the right are the inverse-gamma distributions serving to regularize log2-normalized expression scores. Together, this results in a value equal to the estimated genetic variance of expression. Taking its square root yields a standard deviation, which we use to divide exercise-induced log2FC. In (b), we plot the empirical quantile function for distributions of ratios of each tissue’s exercise-induced log2(gene expression) / SD(log2(gene expression)). As most of the interesting behavior is contained in the tails of each distribution, we applied two separate transforms to the axes of each plot. The horizontal axis, corresponding to a given quantile in (0,1), was logit-transformed. The vertical axis, corresponding to the ratio of DE / SD(log2expression), received an inverse hyperbolic sine transformation. The upper panels are in units of standardized phenotypic effect, and the lower in units of standardized genetic effect for those genes and tissues with significant non-zero (IHW α = 0.10, one-sided). Source data for this figure are provided as a Source Data file.

