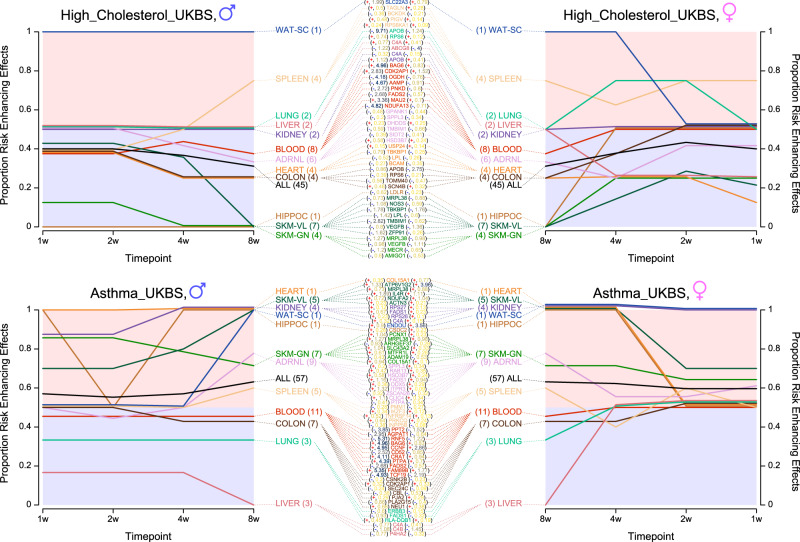
Fig. 6. Examining which trait-associated, exercise-responsive genes are differentially expressed at levels outside natural variation yields interesting candidates for further study.
We visualize the observed proportion of positive effects for the two non-anthropometric traits that had the highest posterior mean enrichment in that proportion according to our proportion of positive effects enrichment model. Above, two panels correspond to self-reported high cholesterol, and below, self-reported asthma. Lines terminate at 8W on the right of each panel, splitting into tissues and genes. Additionally, we trace the proportion for the 8w gene set backwards in time, examining the effect of those genes at 1w, 2w, and 4w. Tissue names are followed by the total number of genes in the intersecting gene set in parentheses, and gene names are followed by their sign (a red + if the effect of DE on the trait is positive and a blue - if negative), and the standardized effect size of DE from Fig. 2b. Additionally, we plot a line corresponding to the set of all gene-tissue pairs in black, labeled ALL. Source data for this figure are provided as a Source Data file.

