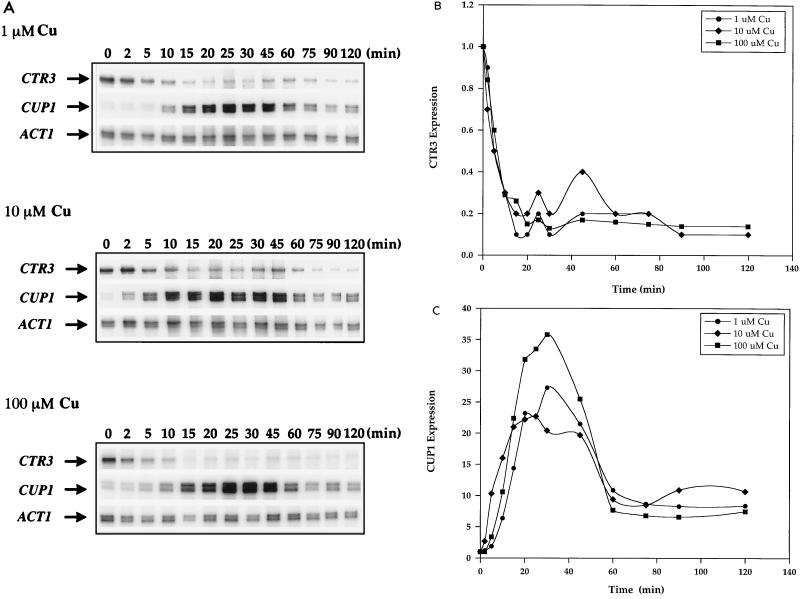
FIG. 1.
Expression of CTR3 and CUP1 in response to 1, 10, and 100 μM CuSO4. (A) Exponential-phase cultures of S. cerevisiae DTY1 were treated with 1, 10, and 100 μM CuSO4. Five-milliliter samples were taken after 0, 2, 5, 10, 15, 20, 25, 30, 45, 60, 75, 90, and 120 min of Cu treatment. RNA extracted from each sample was analyzed by RNase protection assays. Each reaction contained 30 μg of total RNA. CTR3, CUP1, and ACT1 RNAs are indicated by arrows. (B) Quantitation of CTR3 mRNA expression in response to Cu. (C) Quantitation of CUP1 mRNA expression in response to Cu. All values in panels B and C were normalized against those for ACT1 mRNA as an internal control.

