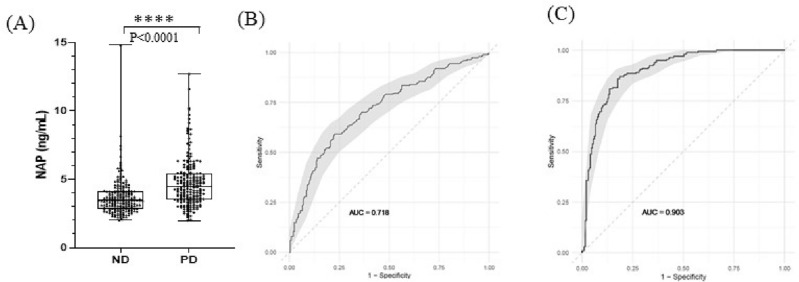
Figure 2.
Plasma Sample Analysis for NAP and Receiver Operation Characteristic (ROC) Curve Analysis (A) The plasma levels of NAP between non-disease and PD cohort.; ROC curve analysis for NAP alone (B) ROC curve analysis for NAP alone and (C) ROC curve analysis for NAP plus three clinical variables (C95% confident interval (CI) using Bootstrapping approach in ROC curve. Statistics was calculated by t-test, statistically significant: ****p < 0.0001.

