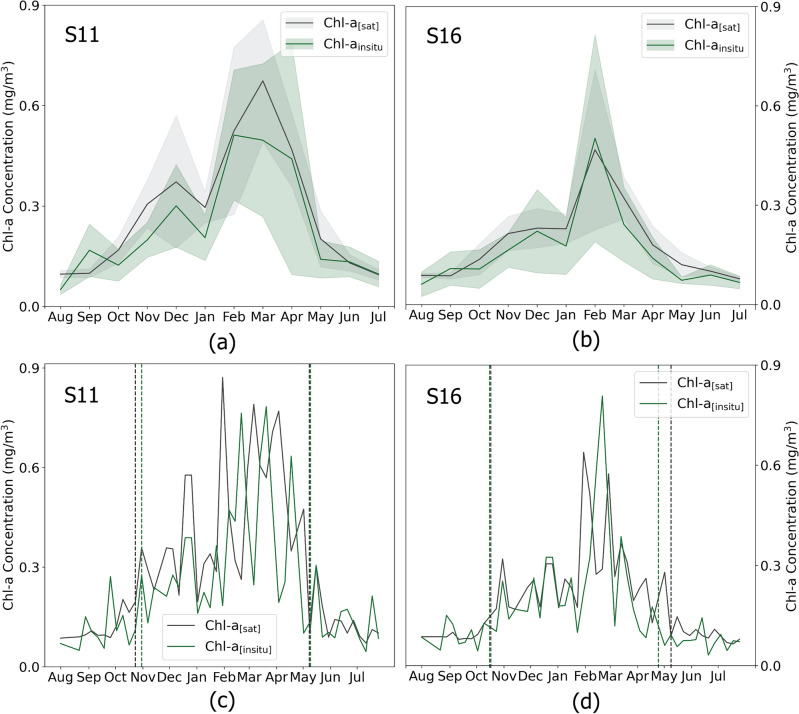
Figure 1.
Seasonal Analysis of Chl-a Concentrations in Saronikos Gulf (1997–2017): Seasonal Variations and Phenology. (a) Monthly Seasonal Cycle at Station S11, (b) Monthly Seasonal Cycle at Station S16, (c) Weekly Time Series and Phenology at Station S11, (d) Weekly Time Series and Phenology at Station S16. Shaded areas in panels (a) and (b) represent the 95% confidence interval. Vertical dashed lines in panels (c) and (d) indicate the initiation and termination of growth periods at both stations.

