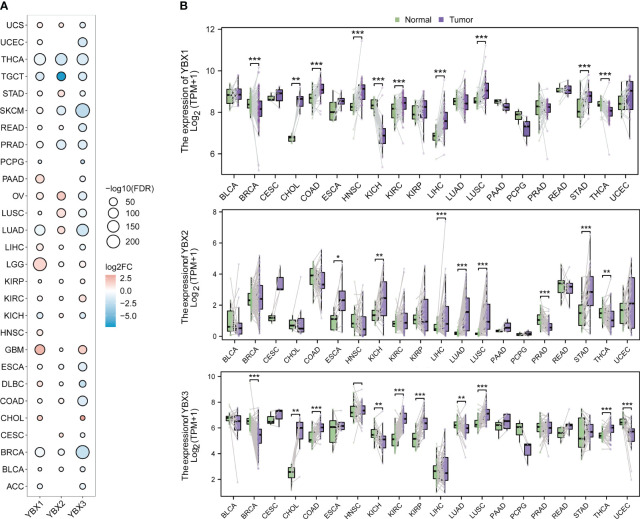
Figure 2.
The different mRNA expression of YBX family genes. (A) Bubble plot of the different mRNA expression of YBX family between tumor and normal tissues based on the TCGA and the GTEx datasets (FC, fold change; FDR, false discovery rate). (B) Violin plot of the different mRNA expression of YBX family in paired tumor and adjacent normal tissues based on the TCGA dataset (*p < 0.05, **p < 0.01, ***p < 0.001).

