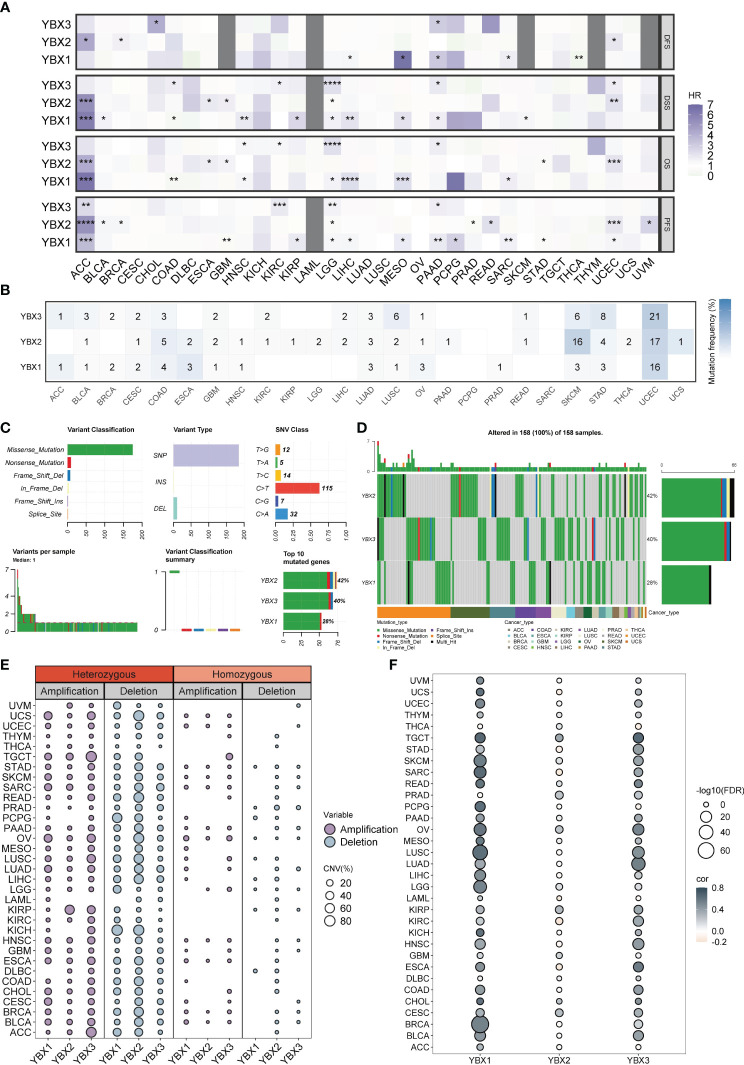
Figure 3.
The prognostic value and the SNV alteration of YBX family genes. (A) Heatmap of the prognostic value of YBX family in each tumor type. Grey portions indicate values that do not apply. (HR, hazard ratio; *p < 0.05, **p < 0.01, ***p < 0.001, ****p < 0.0001). (B) The SNV profile of YBX family in each tumor type. (C) The SNV summary of YBX family in pan-cancer. (D) Oncoplot of the mutation distribution of YBX family in pan-cancer. (E) The heterozygous and homozygous CNV profile of YBX family in each tumor type, including the percentage of amplification and deletion. (F) Bubble plot of the correlations between CNV and mRNA expression of YBX family in pan-cancer (FDR, false discovery rate).

