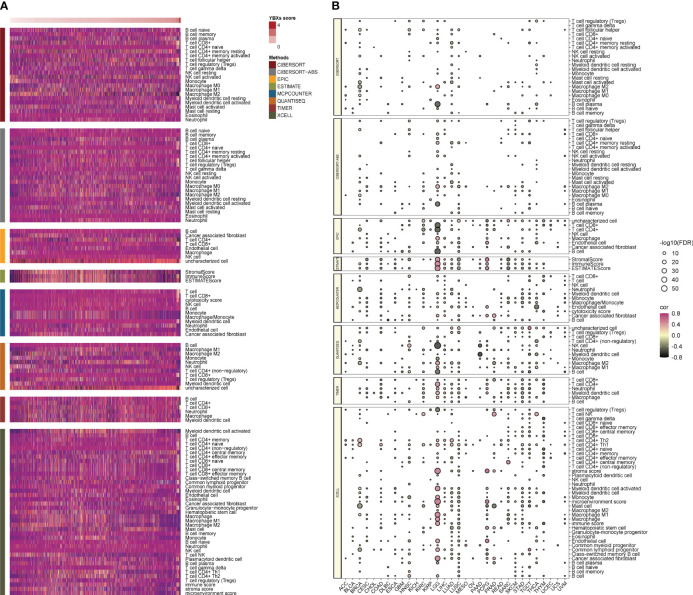
Figure 5.
The correlations between YBXs score and tumor microenvironment as well as immune checkpoints. (A) Heatmap of the tumor microenvironment scores calculated by different algorithms. (B) Heatmap of the correlations between YBXs score and immune checkpoints in each tumor type (FDR, false discovery rate.

