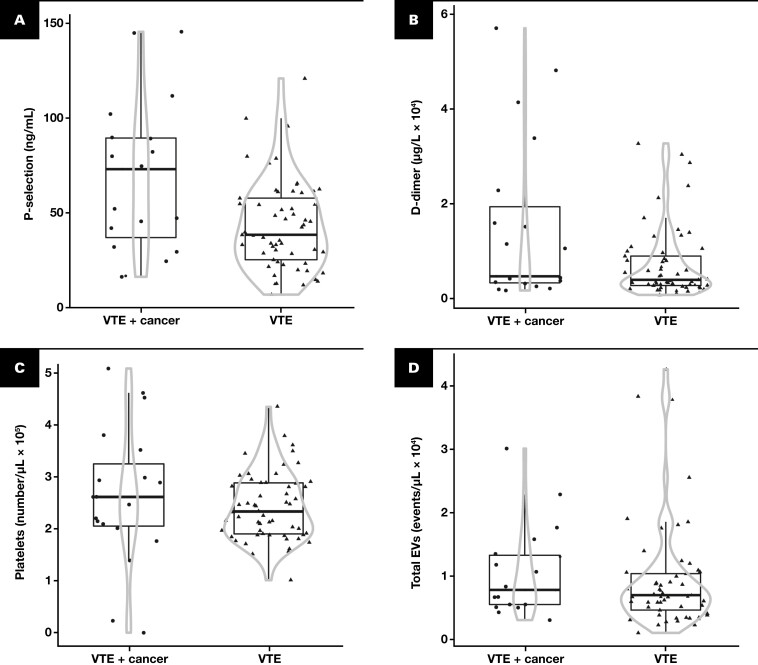
FIGURE 3.
Violin chart showing a comparison of biomarkers in patients diagnosed with VTE and VTE with occult cancer. The biomarkers included soluble P-selectin (A), D-dimer (B), platelets (C), and total EVs (D). Results are expressed as medians (indicated by the horizontal line inside the box) and interquartile ranges (IQRs) (upper and lower horizontal lines defining the box) and 1.5-fold IQRs (whiskers). The circle represents patients with VTE and occult cancer, while the triangle denotes patients with VTE but not cancer. The gray lines demarcate the density area, with the width directly proportional to the frequency. D-dimer, dimerized plasmin fragment D; EV, extracellular vesicle; VTE, venous thromboembolism.

