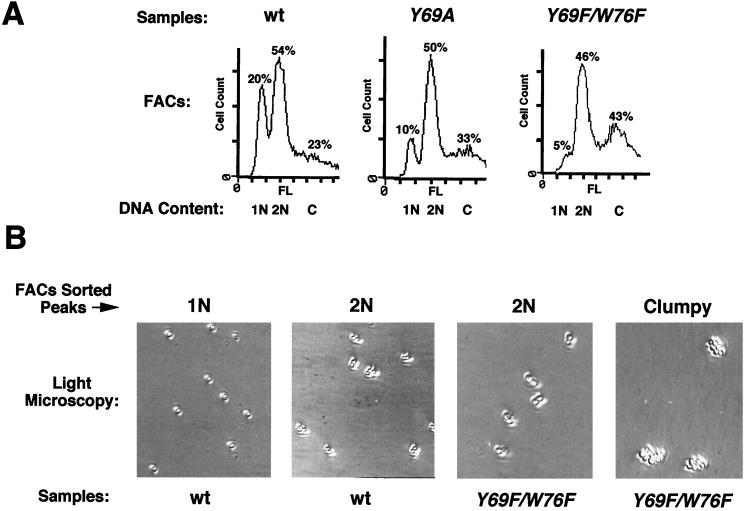
FIG. 3.
toa2 mutants accumulate in the G2/M phase of the cell division cycle. (A) FACS analysis of the toa2 Y69A and Y69F/W76F mutants. For each sample, haploid (1N), diploid (2N), and clumpy cells (C) are indicated beneath each peak. Cell count is plotted as a function of fluorescence (FL). For cell count, each dash represents 25 cells. The percentage of sorted cells in each peak is shown above the peak. (B) Light microscopy of FACS-sorted peaks. For the wt and the Y69F/W76F mutant, haploid, diploid, or clumpy peaks were individually FACS sorted and viewed by light microscopy (magnification, ×32) and photographed. For each sample, representative pictures of major peaks are shown (either 1N, 2N, or clumpy).

