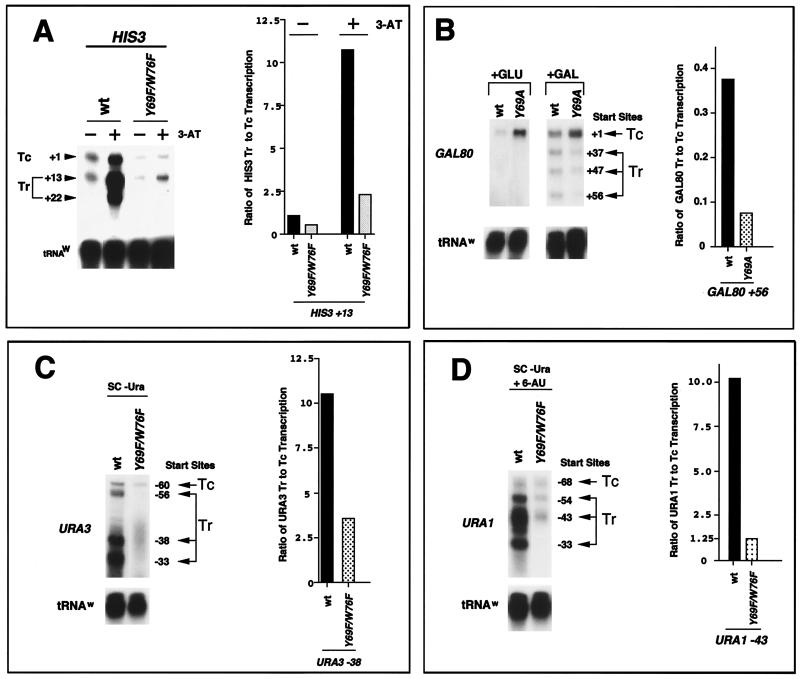
FIG. 6.
toa2 Y69A and Y69F/W76F mutants show defects in activator-induced start site switching. (A) HIS3 TC (+1) and TR (+13 and +22) start site expression for wt and toa2 Y69A. 3-AT (45 mM) was added to the medium for 2.5 h at 30°C prior to RNA isolation. PhosphorImager quantitation of the S1 assays is presented as the ratio of TR (+13) to TC (+1). (B) The wt and toa2 Y69A strains were used to assay GAL80 TR expression in vivo. Expression levels were measured under glucose repression (+GLU) and under galactose induction (+GAL). GAL80 TC (+1) and TR (+37, +47, and +56) start site expression is shown (64). (C) The wt and toa2 Y69F/W76F strains, containing a wt URA3 CEN plasmid, were grown in SC medium at 30°C, and total RNA was isolated. S1 analyses were performed to determine transcription efficiency from the multiple URA3 start sites. The TC (−60) and TR (−56, −38, and −33) start sites relative to the translation start site (AUG) are shown (46). (D) S1 analyses were similar to those described for panel C, except that endogenous URA1 expression was induced by 6-azauracil (10 μg/ml) for 2.5 h at 30°C. The URA1 TC (−68) and TR (−54, −43, and −33) start sites relative to AUG are shown (46). The ratio of TR to TC transcription is indicated on the right for each experiment. Forty micrograms total RNA was used per S1 reaction.

