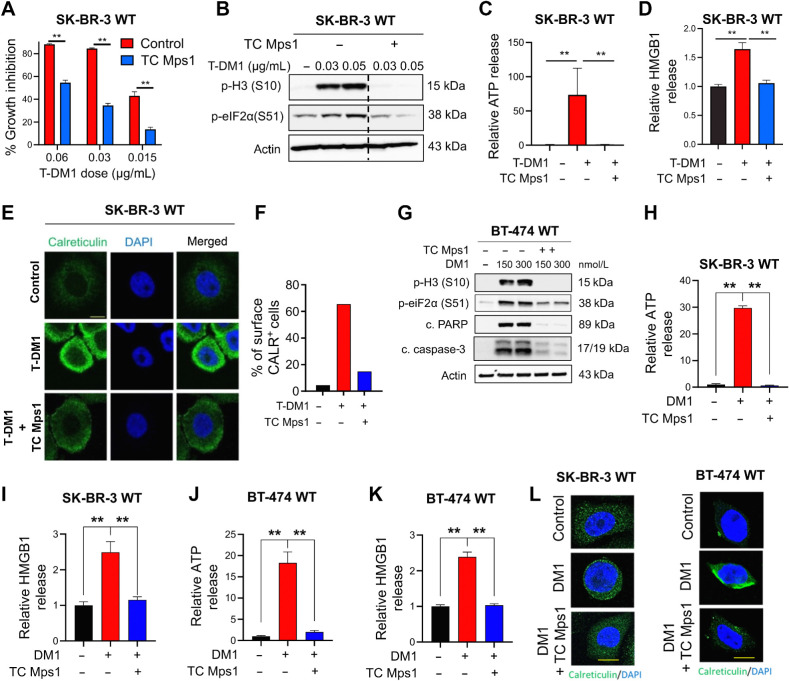
Figure 2.
T-DM1–induced ICD is driven by SAC-dependent mitotic arrest induced by the payload, DM1. A, Percent growth inhibition in SK-BR-3 WT cells treated with T-DM1 alone or in combination with 1 μmol/L TC Mps1 (Mps1 inhibitor; n = 4). B, Western blot analysis of p-H3 and p-eIF2α in SK-BR-3 WT cells treated with T-DM1 alone or in combination with 1 μmol/L TC Mps1. Actin was used as a loading control. C and D, Relative ATP (C) and HMGB1 (D) release in SK-BR-3 WT cells treated with T-DM1 alone or in combination with 1 μmol/L TC Mps1 (n = 3). E, Immunofluorescence cell-surface staining of calreticulin (green) in SK-BR-3 WT cells treated with T-DM1 alone or in combination with 1 μmol/L TC Mps1. Scale bar, 10 μm. F, The quantification graph of E. G, Western blot analysis of mitotic arrest, apoptosis, and the ICD marker, p-eIF2α (S51), in BT-474 cells treated with two different doses of DM1 (150 and 300 nmol/L) with or without TC Mps1. Actin was used as the loading control. H and I, Relative ATP (H) and HMGB1 (I) release in SK-BR-3 cells treated with DM1 (15 nmol/L) with or without TC Mps1 (n = 3). J and K, Relative ATP (J) and HMGB1 (K) release in BT-474 cells treated with DM1 (150 nmol/L) with or without TC Mps1 (n = 3). L, Surface calreticulin staining of SK-BR-3 and BT-474 cells treated with DM1 (15 nmol/L for SK-BR-3 and 150 nmol/L for BT-474) with or without TC Mps1. Data correspond to mean values ± SD. P values were calculated with the unpaired, two-tailed Student t test. **, P < 0.01.

